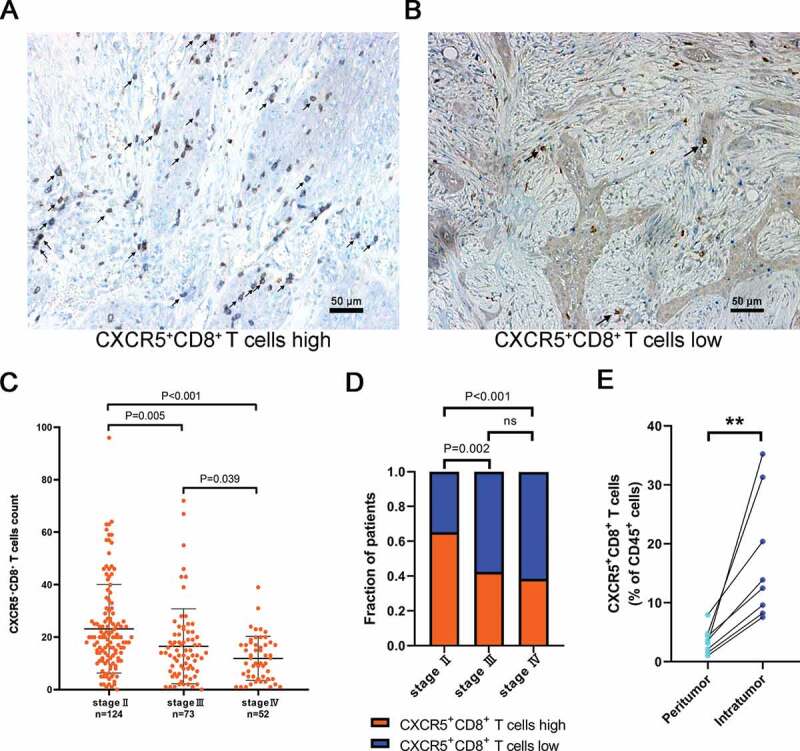
Figure 1.

Intratumoral CXCR5+CD8+ T cell infiltration correlates with tumor stage.
Representative IHC images of high (a) and low (b) CXCR5+CD8+ T cells infiltrated in MIBC with black arrowheads pointing the target cells. (c) Comparison of intratumoral CXCR5+CD8+ T cell count according to different AJCC stages. The data were based on Supplementary Table 5. (d) Distribution of tumors with CXCR5+CD8+ T cells high/low subgroups according to different AJCC stages. The data were based on Supplementary Table 5. ns refers to no statistical significance. (e) Different infiltration levels of CXCR5+CD8+ T cells in tumor tissue and peritumoral tissue. *P < .05, **P < .01.
