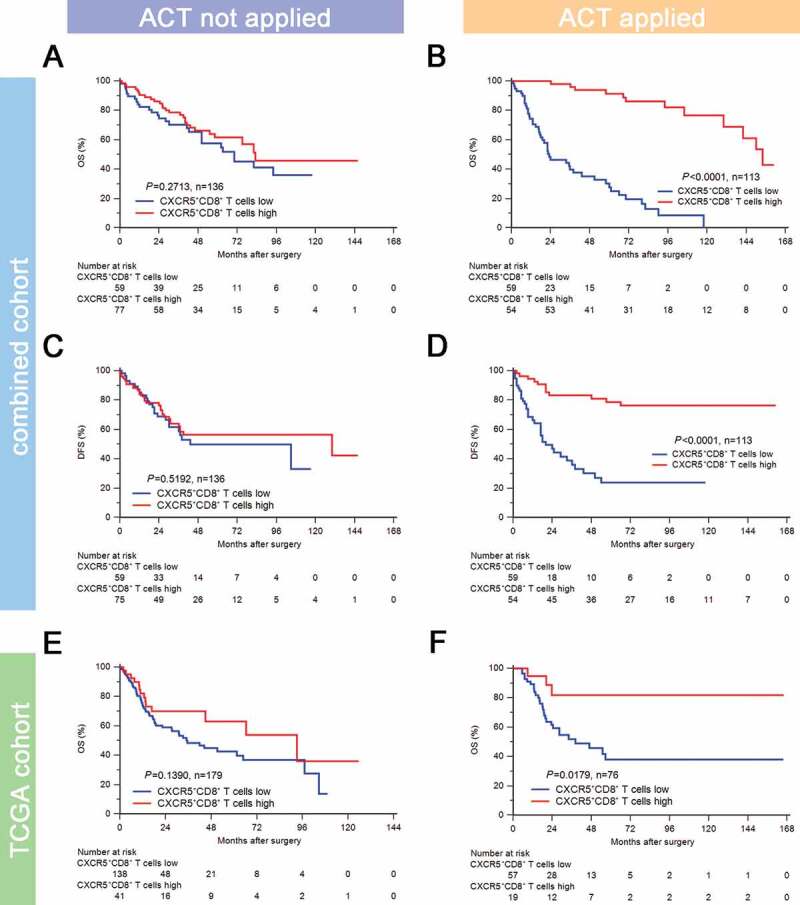
Figure 3.

Intratumoral CXCR5+CD8+ T cell abundance yields optimal ACT responsiveness.
Kaplan-Meier curves for OS in ACT applied (a) and ACT not applied (b) subgroups of combined cohort according to CXCR5+CD8+ T cell infiltration strata. Kaplan-Meier curves for DFS in ACT applied (c) and ACT not applied (d) subgroups of combined cohort according to CXCR5+CD8+ T cell infiltration strata. Kaplan-Meier curves for OS in ACT applied (e) and ACT not applied (f) subgroups of TCGA cohort according to CXCR5+CD8+ T signature score strata. Log-rank test was performed for Kaplan-Meier curves.
