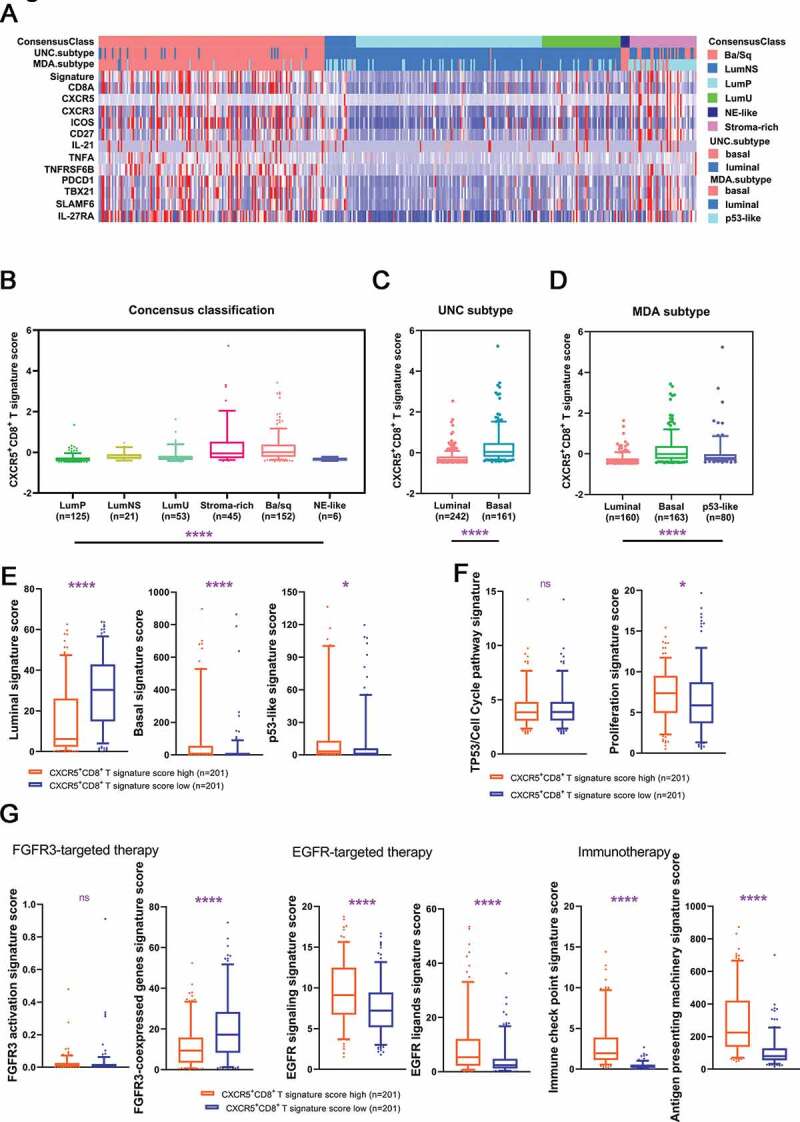
Figure 5.

Characteristics of CXCR5+CD8+ T cells across MIBC molecular classifications.
(a) The overall constitution of CXCR5+CD8+ T signature score and the corresponding molecular classification. (b–d) Quantification analyses of CXCR5+CD8+ T signature score in TCGA database across molecular classification systems. (e) Quantification analyses of molecular subtype signatures between low/high CXCR5+CD8+ T signature score subgroup. Quantification analyses of cell cycle-associated (f) and therapy-associated (g) gene signatures between low/high CXCR5+CD8+ T signature score subgroup. Data was analyzed by Kruskal-Wallis H test and Mann-Whiney U test. *P < .05, **P < .01, ***P < .001, ****P < .0001.
