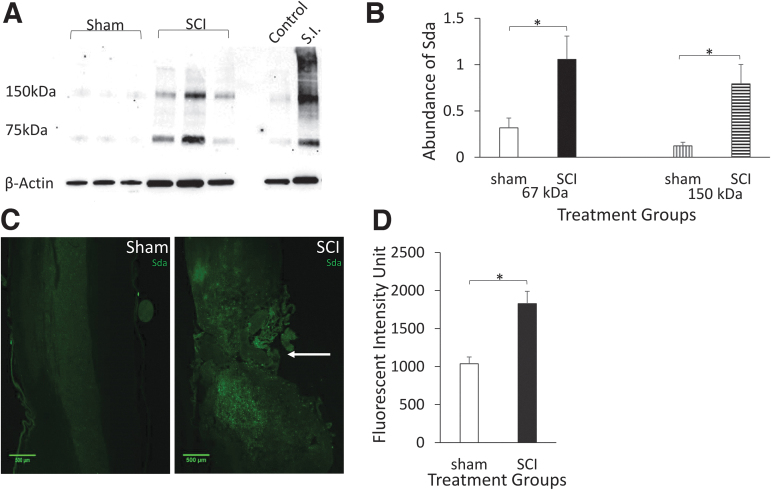
FIG. 5.
Expression of Sda structure is upregulated in injured spinal cords. (A) Western blot of spinal tissue shows two major bands at 67 kDa and 150 kDa, upregulated in injured spinal cords. Bands on right show control spinal tissue and small intestine (S.I.) positive control. (B) Quantification of Sda western blot band intensities. Data are presented as mean + SEM (n = 5, *p < 0.05, single-factor ANOVA). (C) Fluorescent images of sham and SCI tissue labeled for Sda at T10 (arrow). (D) Quantification of Sda fluorescent intensity of sham and SCI at T10. Data are presented as mean + SEM (n = 6, *p < 0.05, single-factor ANOVA). ANOVA, analysis of variance; SCI, spinal cord injury; SEM, standard error of the mean. Color image is available online.

