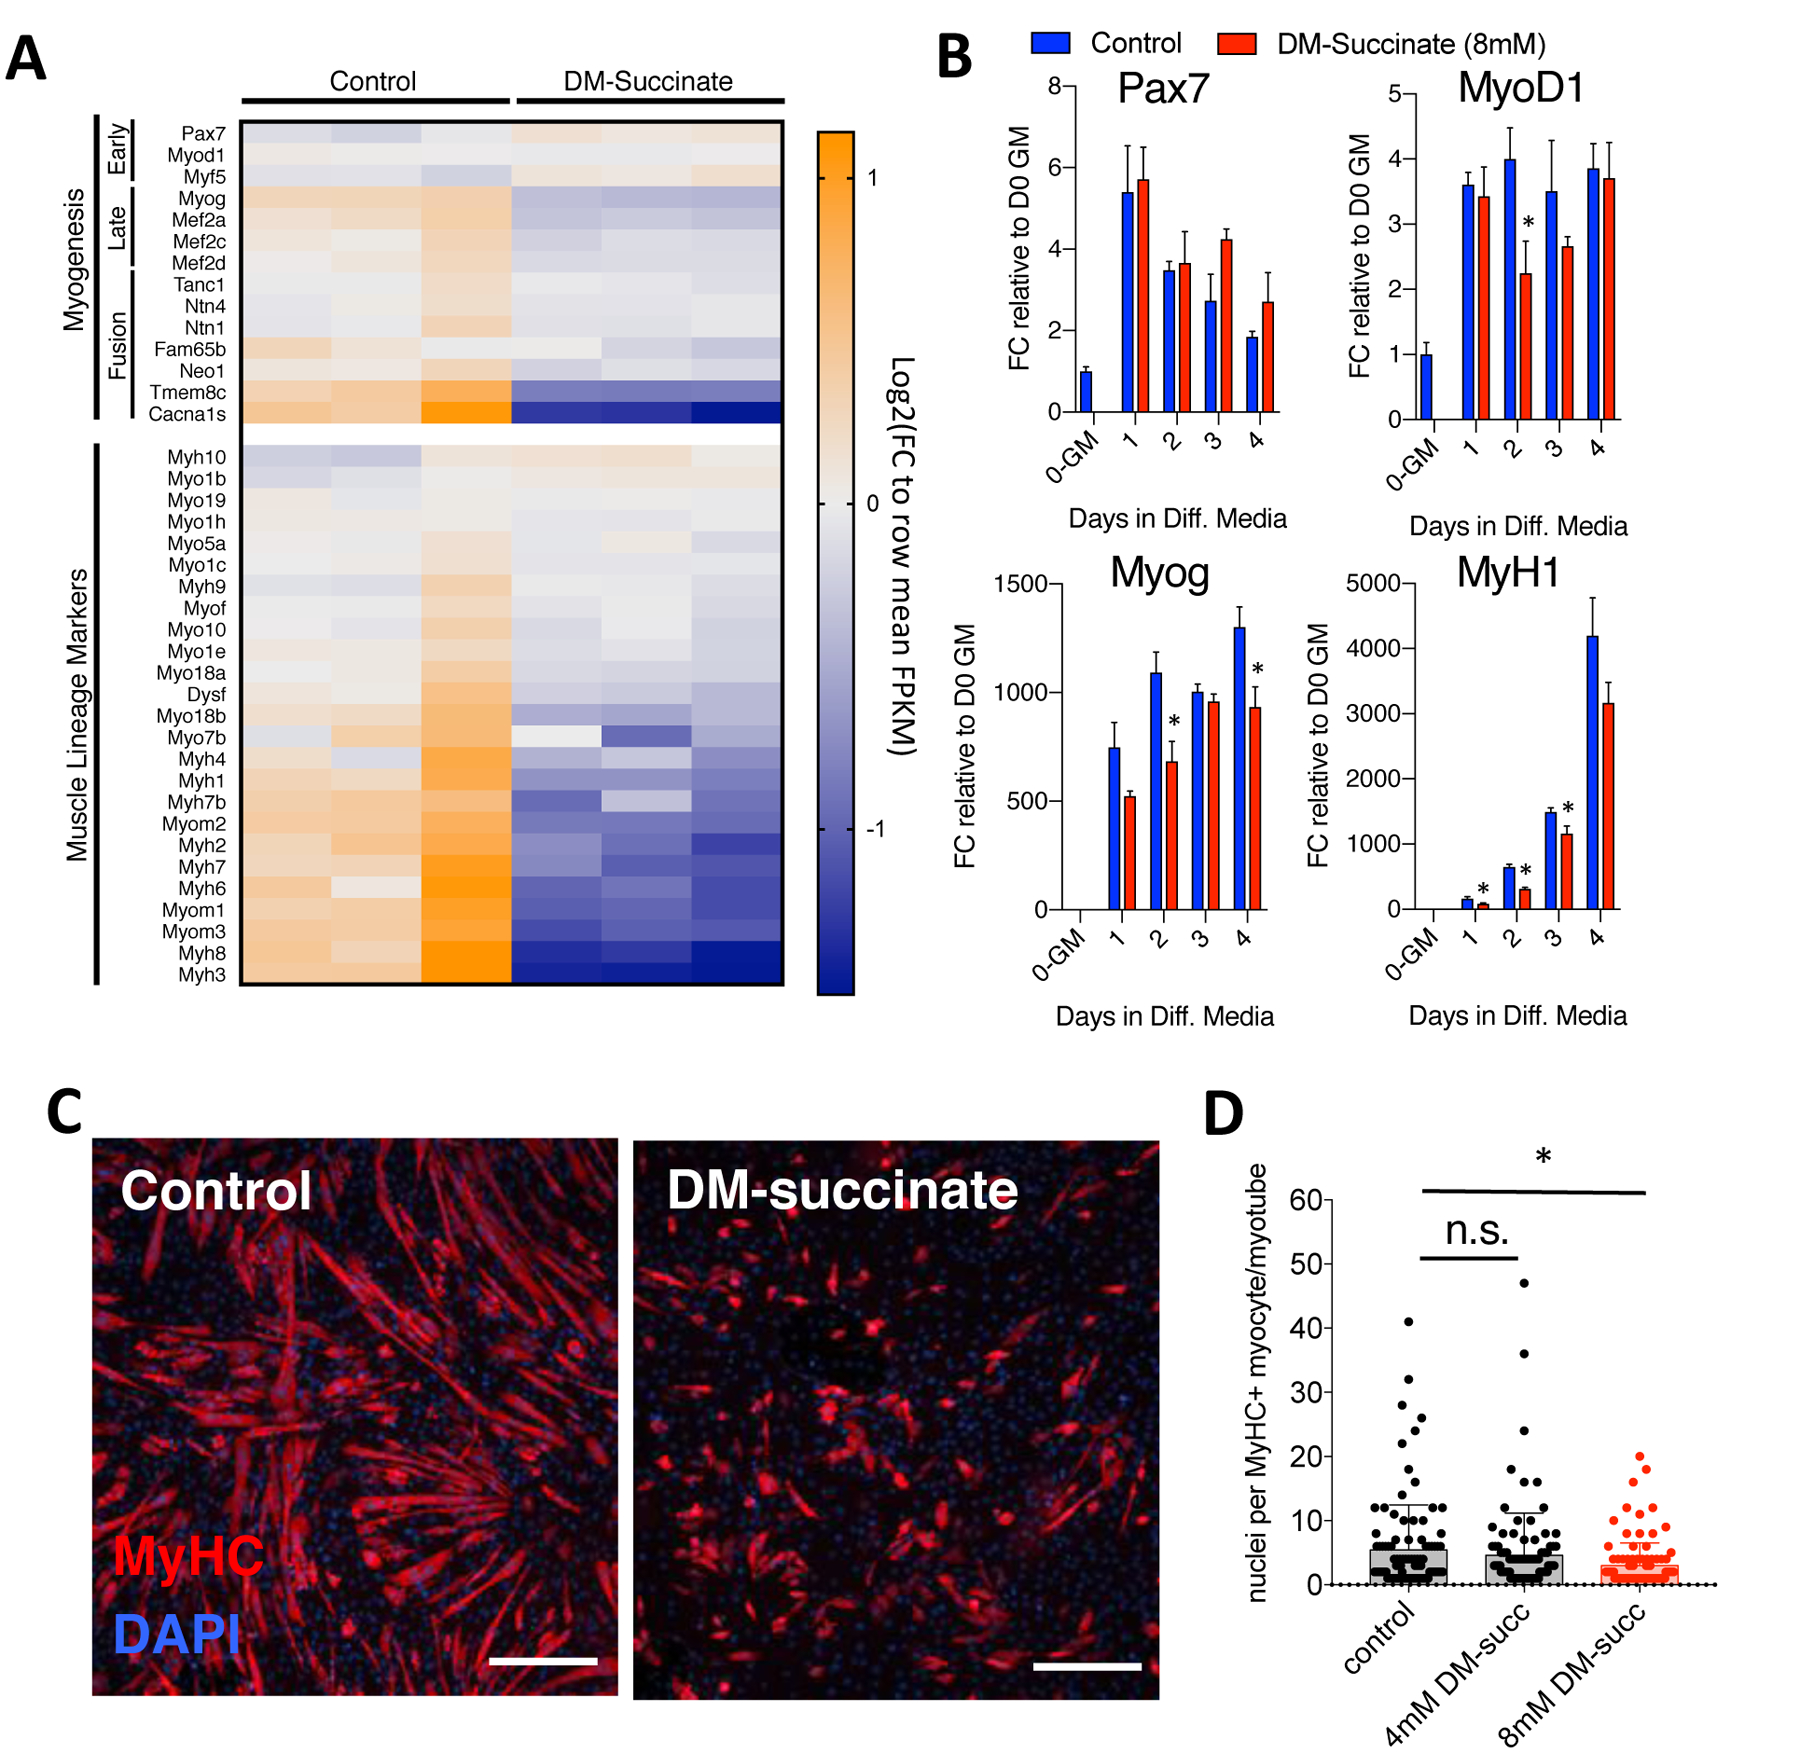
Figure 2: Elevated succinate levels impair in vitro myogenesis.

(A) RNA sequencing analysis of proliferating C2C12 myoblasts treated with 8 mM DM-succinate for 48 hours. Heatmap depicting normalized FPKM values for myogenic and muscle lineage marker expression values. Blue=lower relative expression, orange=higher relative expression. n=3 replicates for each condition. (B) qPCR analysis of myogenic markers Pax7, MyoD1, Myog, and MyH1. Bar graphs depicting mRNA expression FC relative to D0-growth media at 0, 1, 2, 3, and 4d in differentiation media +/− 8 mM DM-succinate. n=3 replicates for each timepoint/condition, *p<0.05 between control and succinate samples for marked timepoints, as determined by multiple t tests with Holm-Sidak multiple testing correction. (C) Representative images of C2C12 cultures in the presence of differentiation media supplemented with 8mM DM-succinate for the entirety of differentiation (5 days). Red depicts myosin heavy chain positive myocytes and maturing myotubes. Nuclei are shown in blue (DAPI). Scale bar=100um. (D) A graph depicting the number of nuclei per myosin heavy chain positive structure (one point=one structure). Red=statistically significant (p<0.05) mean of biological replicates compared to control using unpaired, nonparametric, Mann-Whitney tests. n=4 replicates control/8mM DM-succinate, n=5 replicates 4mM DM-succinate, 20–40 myotubes/replicate.
