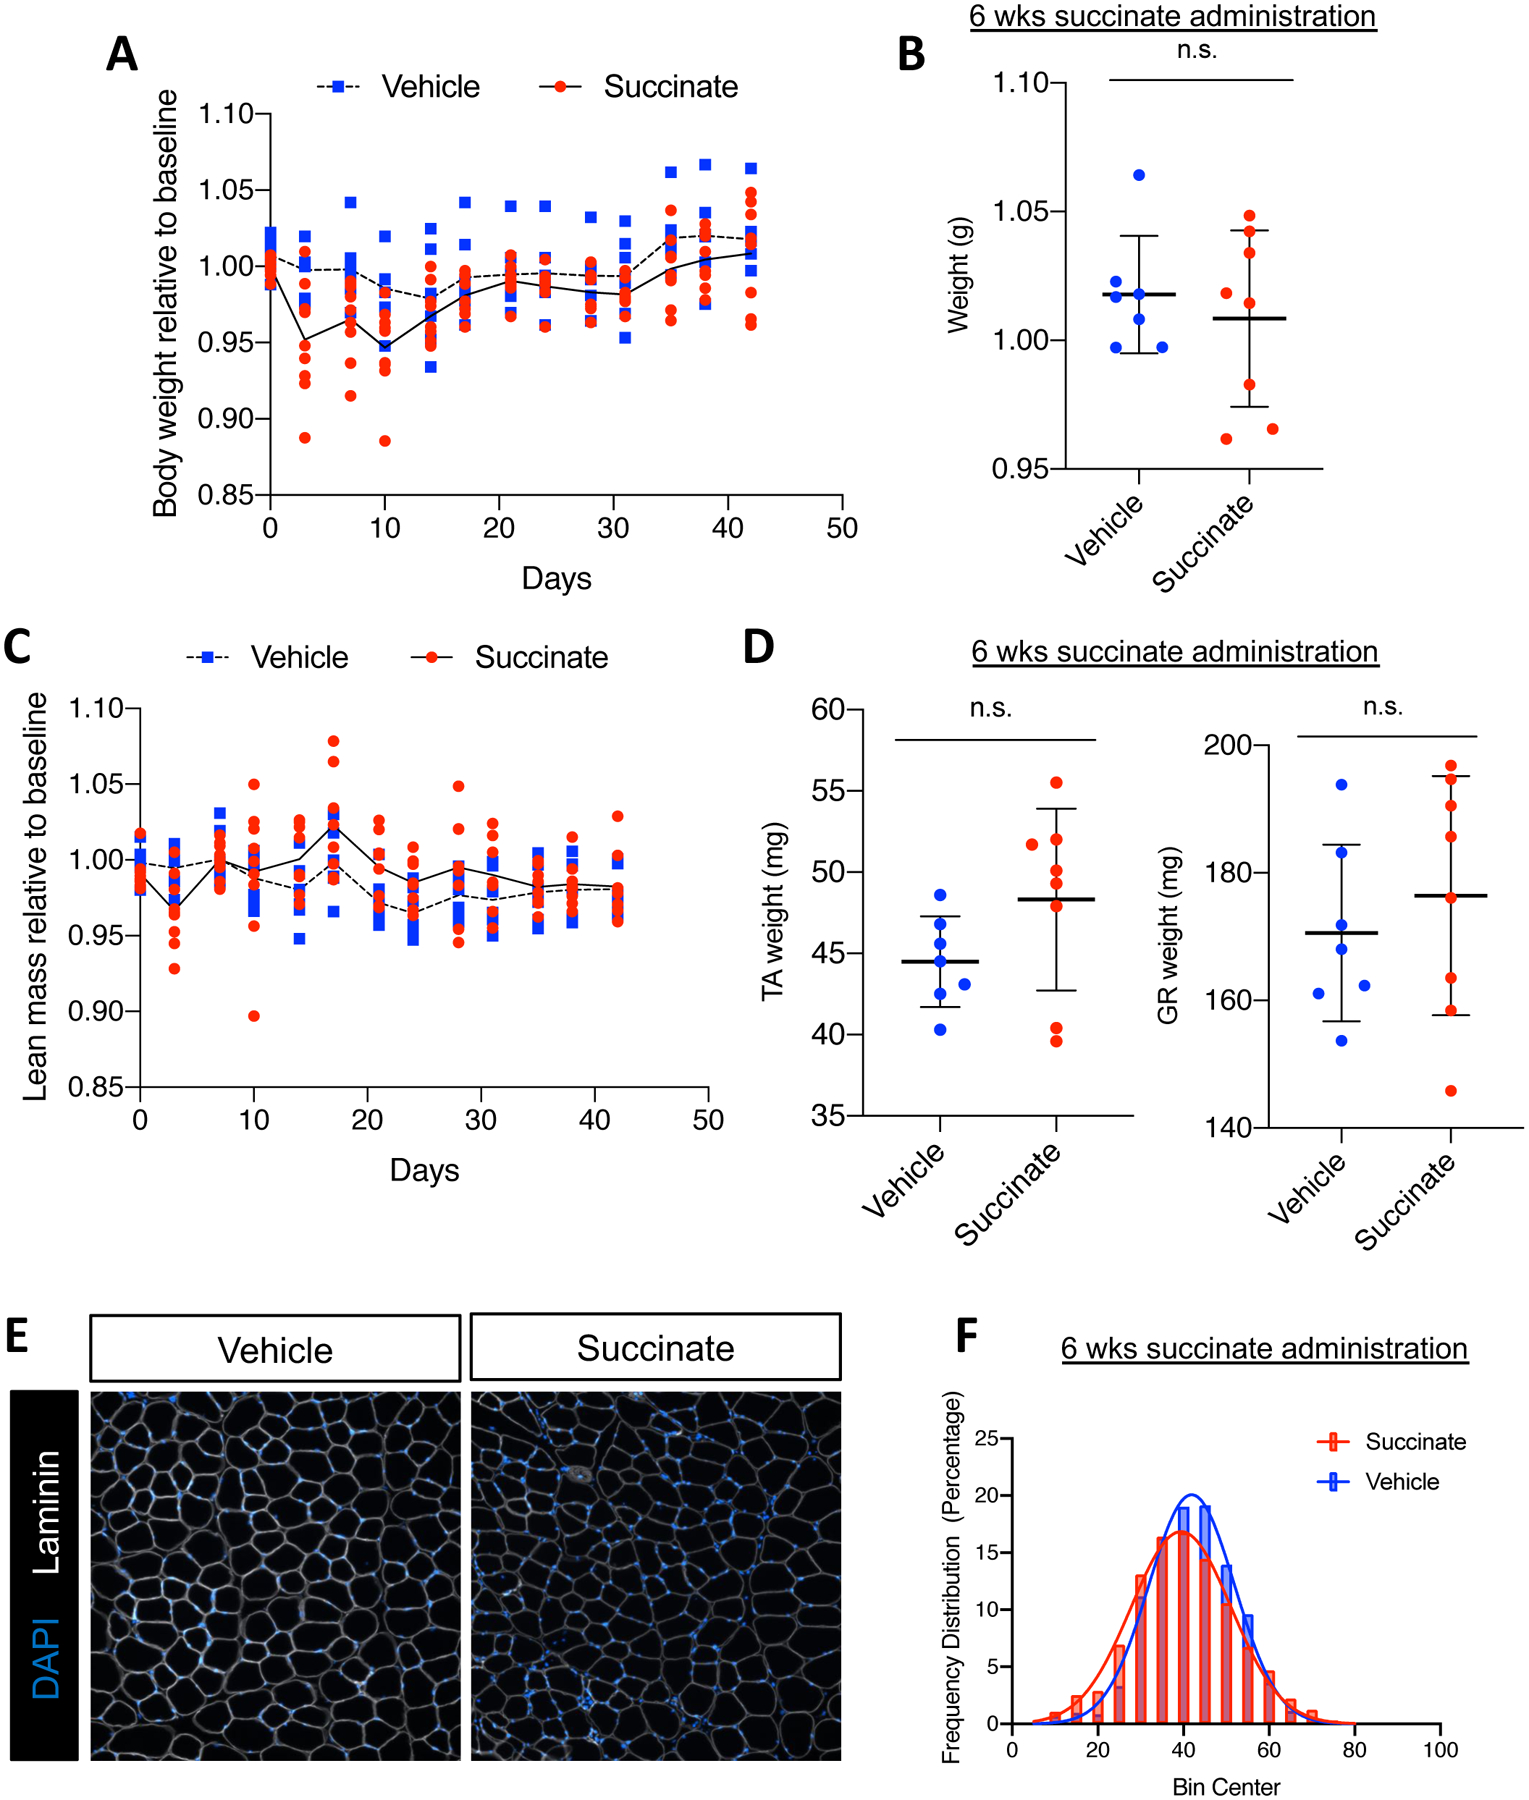
Figure 3: Succinate supplementation impairs skeletal muscle homeostasis.

(A) Bi-weekly body weight tracking over 6-week succinate supplementation. Weights are normalized to pre-supplementation baseline measures. Individual points are individual animals, line represents the mean at each time point. (B) Mouse weight at endpoint, normalized to pre-supplementation baseline measures. (C) Bi-weekly echoMRI-measured lean mass normalized to pre-supplementation baseline measures. Individual points are individual animals, box represents the quartiles and whiskers represent the minimum and maximum values. (D) Weights of tibialis anterior (TA) and gastrocnemius (GR) at endpoint in milligrams. Individual points are individual animals, box represents the quartiles and whiskers represent the minimum and maximum values. (E) Representative images of TA muscle tissue sections from vehicle or succinate supplemented mice after 6 weeks administration. Cross sections are immunofluorescent stained with an antibody targeting laminin (white). Nuclei are labeled with DAPI (blue). Scale bars=100 μm (F) Quantification of minimum feret diameter of myofibers from vehicle and succinate supplemented mice. Feret diameters were binned to a histogram and fit with a non-linear regression (gaussian, least squares regression). Succinate exposed myofibers were significantly smaller; P< 0.0001 by extra sun-of-squares F test. n.s. = not significant by student’s t test, n=7 vehicle, n=8 succinate-supplemented FVB male mice, 4–5 months old at the start of the study.
