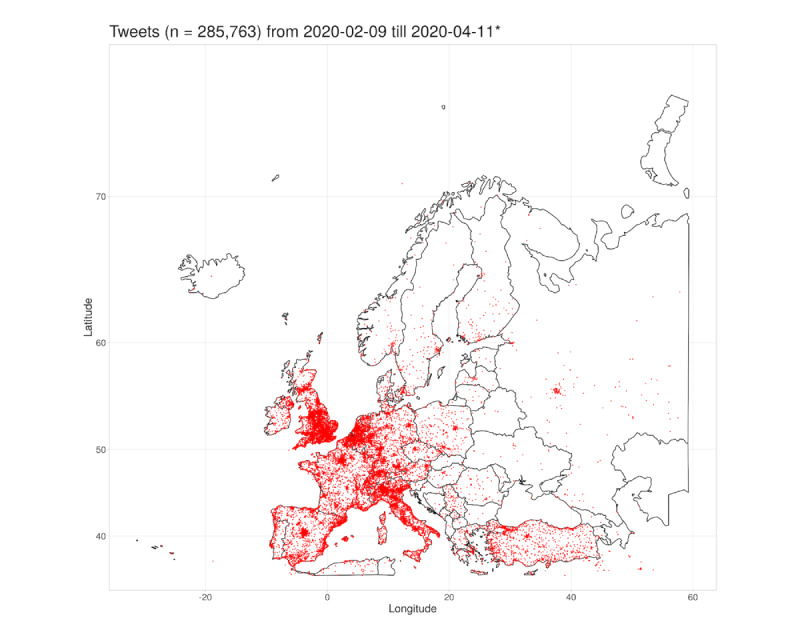
Figure 5.

Cumulative depiction of all tweets in European countries between February 9 and April 11, 2020. Each red dot denotes one tweet. Tweets with the same geographical information are plotted on top of each other. *No tweets were collected between February 20, 2020, and February 22, 2020, and between March 28, 2020, and March 29, 2020, due to technical issues.
