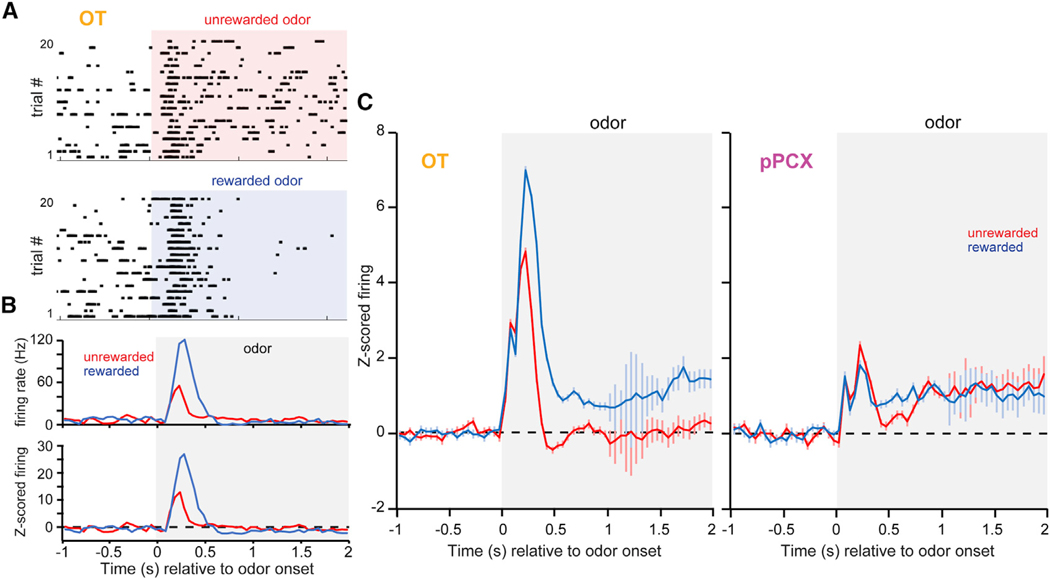
Figure 2. Neural Dynamics During Odor that Reflect Reward Associations.
(A) Example OT single-neuron rasters in response to conditioned rewarded and unrewarded odors.
(B) Average firing rate and Z-score-normalized firing (top and bottom panels, respectively) calculated across trials for the same neuron in (A).
(C) Peri-stimulus time histograms of Z-score-normalized firing rates (mean ± SEM) from task-responsive neurons in the OT (left; n = 104 unit-odor pairs) and pPCX (right; n = 70 unit-odor pairs) from both conditioned rewarded and unrewarded odors. The classifications of “rewarded” and “unrewarded” are global aggregates, with each panel including data from 8–12 different odors. Shaded boxes in all panels indicate the timing of odor.

