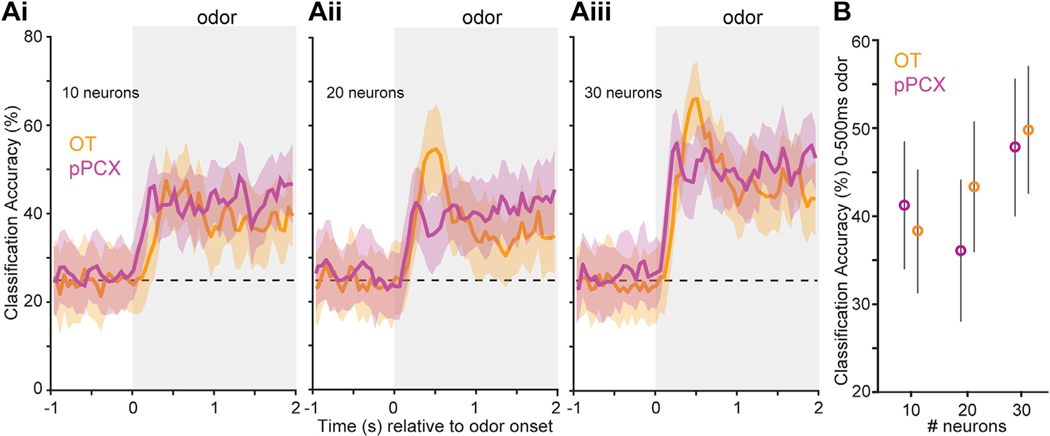
Figure 3. Classification Accuracy for pPCX and OT Units to Differentiate Trial Type.
Peri-stimulus time histograms indicate accuracy for classifying trial types (conditioned rewarded versus unrewarded) (A). Ensembles from both brain regions display classification accuracy greater than chance (probability line is indicated by a horizontal dashed line) and above the shuffled data beginning soon after odor onset which, while not displayed for visual simplicity, never exceeded 33.7%. Accuracy became greater with increasing numbers of randomly sampled neurons provided to the classifier (10 neurons to 30 neurons; Ai to Aiii, respectively), which was also observed when the analysis window was restricted to the first 500 ms of odor onset (B). Shaded boxes indicate the timing of odor. Values represent the mean ± SD of the resamples.

