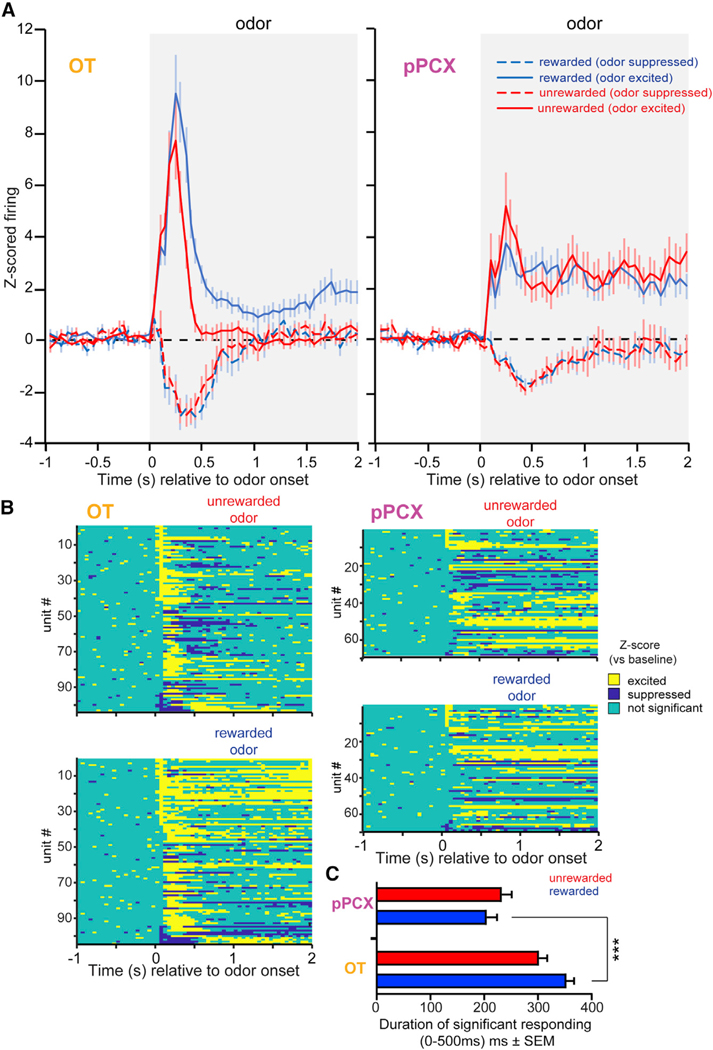
Figure 4. Differential Representation of Reward-Associated Odors in the OT Compared to the pPCX.
(A) Peri-stimulus time histograms of Z-score-normalized firing rates in the OT (left) and pPCX (right) from both conditioned rewarded and unrewarded odors, as in Figure 2, but separated by whether the response was excited or suppressed relative to baseline. Population values represent the mean ± SEM. Shaded boxes indicate the timing of odor.
(B) Z-score results from individual neuron-odor pairs indicating the timing of significant bins. Data are organized in descending order based on the significant excitation in the first 50-ms bin.
(C) Cumulative time that significantly responding neurons were modulated during the first 500 ms of odor onset, on average, across neurons (mean ± SEM). ***p < 0.001. n = 100 OT and 68 pPCX neuron-odor pairs. See Results for additional statistical outcomes.

