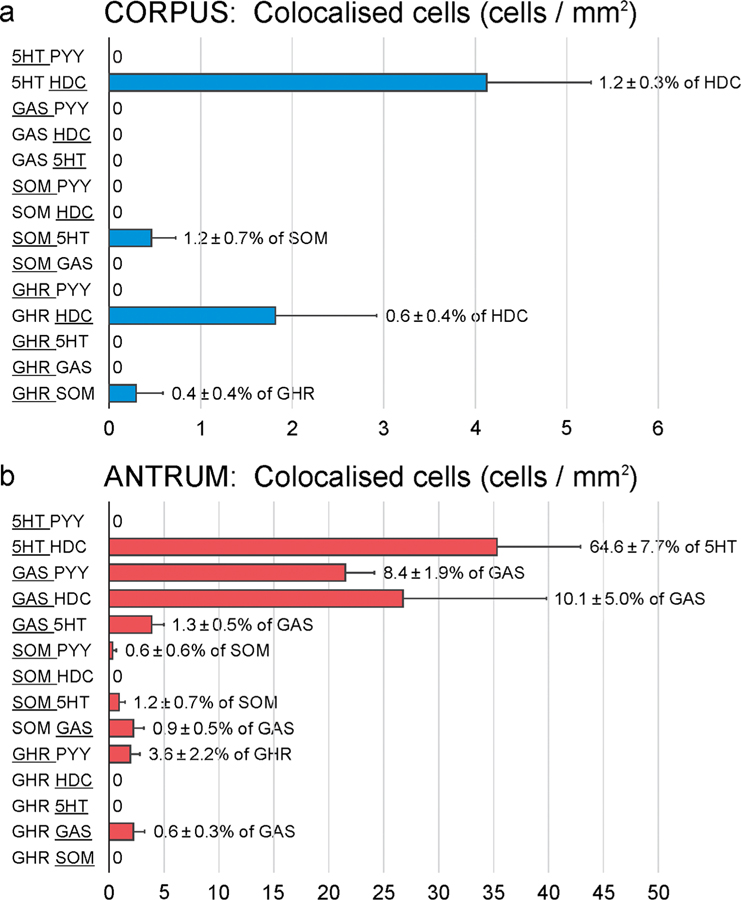
Fig. 6.
Quantitation of overlaps between hormones in the rat gastric corpus (a) and antrum (b). At left the double labelling combinations that were investigated are indicated. A range of triple label combinations were also examined (e.g. Fig. 5) but very few triple-labelled cells were found. ‘0’ against a combination indicates that no colocalisation of this combination was found. Note the differences in the scales on the X-axes, between (a) and (b). The proportion of the larger group of cells that contained the other hormone is indicated to the right of the bar. The larger group is indicated by the underlining. Data is mean ± SEM, n = 3 gastric samples

