Fig. 2.

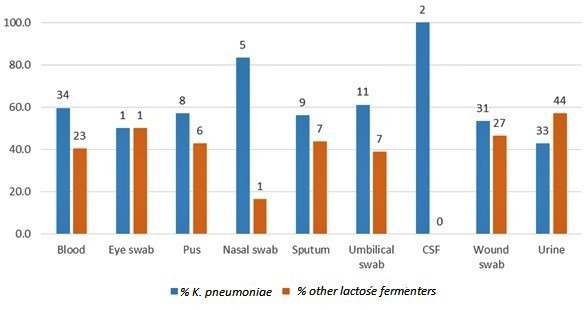
Samples from which K. pneumoniae was isolates. The blue bars indicate the number of isolates identified by the 16S−23S rDNA ITS, whereas the orange bars indicate the number of misidentified organisms.

Samples from which K. pneumoniae was isolates. The blue bars indicate the number of isolates identified by the 16S−23S rDNA ITS, whereas the orange bars indicate the number of misidentified organisms.