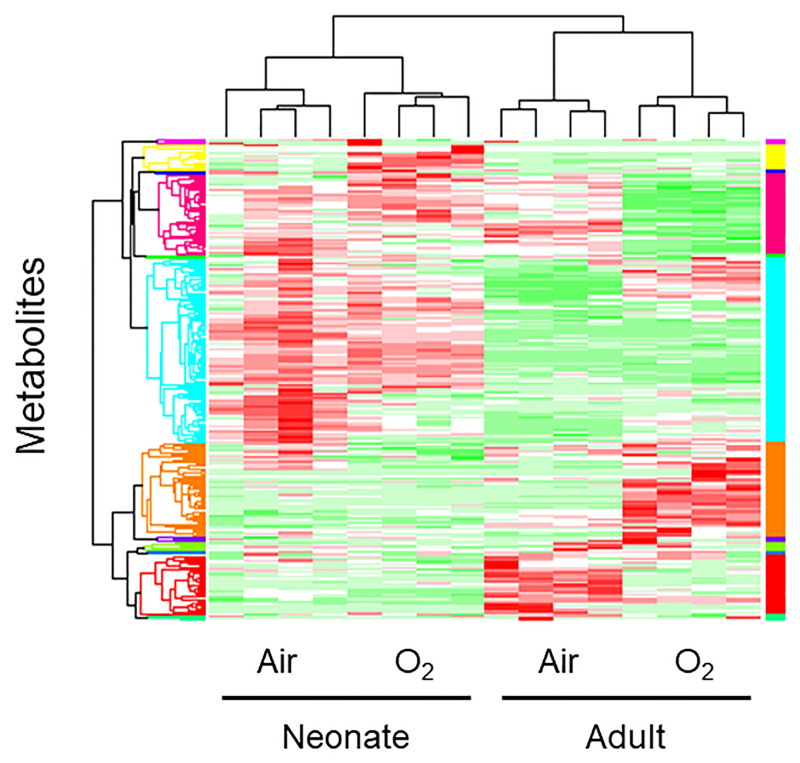
Fig 1. Visualization of the profiles of the detected metabolites uasing a heat map.
Columns represent individual mice, and row represent specific metabolites. The color scale from green to red indicates relative changes in the levels of the detected metabokites. Red indicates that the relative level of the metabolite is higher than the average, and green indicates that the relative level of the metabolite is lower than the average. Lungs were obtained from four different groups of mice: room air newborn, high O2 concentration newborn, room air adult, and high O2 concentration adult groups. The four major clusters distinguished by HCA are coincident with the four groups.

