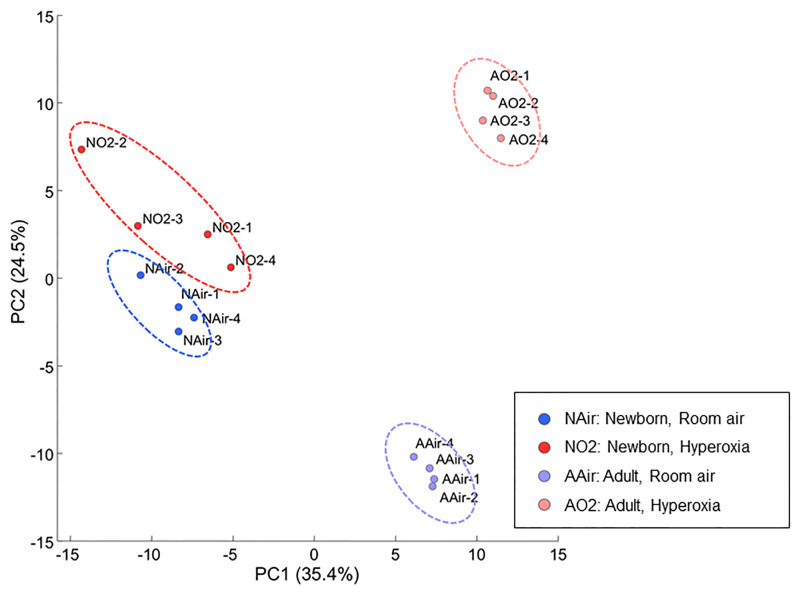
Fig 2. Principal component analysis of the metabolomic dataset of the four groups.
Percentage on the axes represent the contribution rate of the first (PC1) and second (PC2) principal components. PC1 and PC2 had contribution ratios of 35.4% and 24.5%, respectively, and were sufficient to distinguish the four groups. Ellipses are graphical representations of groups without any statistical support. NAir, newborn, room air; NO2, newborn hyperoxia; AAir, adult room air; AO2, adult, hyperoxia; PC, principal component.

