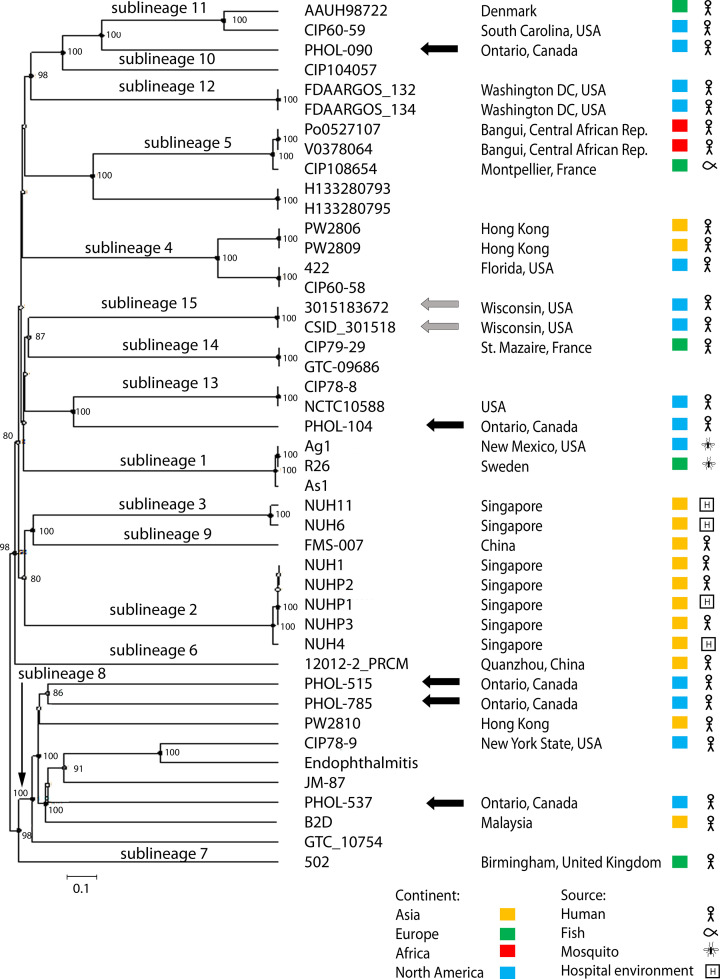
Fig. 1.
Genomic comparison using the UPGMA algorithm based on cgMLST profiles (1546 genes) of E. anophelis strains. The position of the 5 Ontario isolates (black arrows) is shown among a collection of 2 Wisconsin outbreak (grey arrows) isolates and 37 other strains representing the known diversity of the sublineages [6]. The scale bar corresponds to 10 % allelic mismatches (out of 1546 gene loci). Nodes with >80 % bootstrap support (n=1000 replicates) are indicated.

