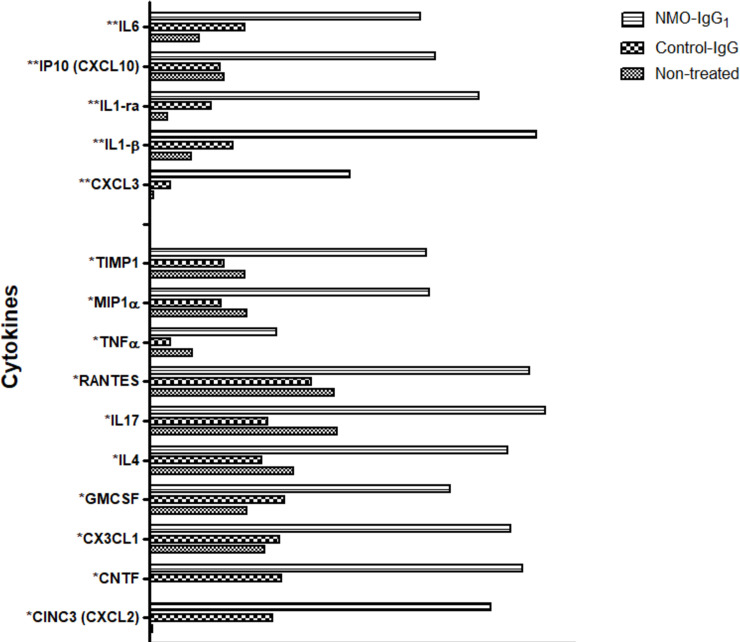
Fig 2. Cytokine/chemokine levels in the supernatant of IBMs after 9 hours of treatment with NMO-IgG1, Control-IgG and those of non-treated microvessels.
*2 and **3-fold increase in fluorescence signal intensity in NMO-IgG1 vs. Control-IgG.or non- treated microvessels. IgG were added at the final concentration of 200 μg/mL. Protein levels were assessed using membrane arrays and the measured densitometric signals are expressed as arbitrary units.

