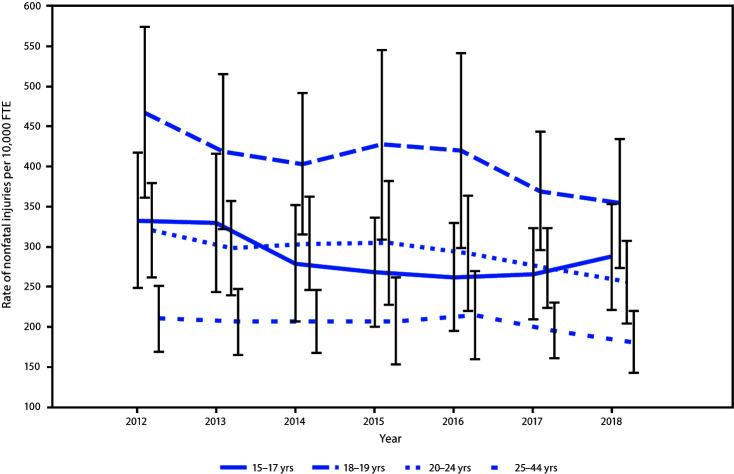
FIGURE.
Rate of hospital emergency department–treated nonfatal occupational injuries,* by age group — National Electronic Injury Surveillance System occupational supplement, United States, 2012–2018†
Abbreviation: FTE = full time equivalent.
*Nonfatal injury rates are per 10,000 FTE workers; one FTE = 2,000 hours worked/year. U.S. Census Bureau's Current Population Survey labor force denominator estimates were used to calculate rates.
† With 95% confidence intervals indicated by error bars.

