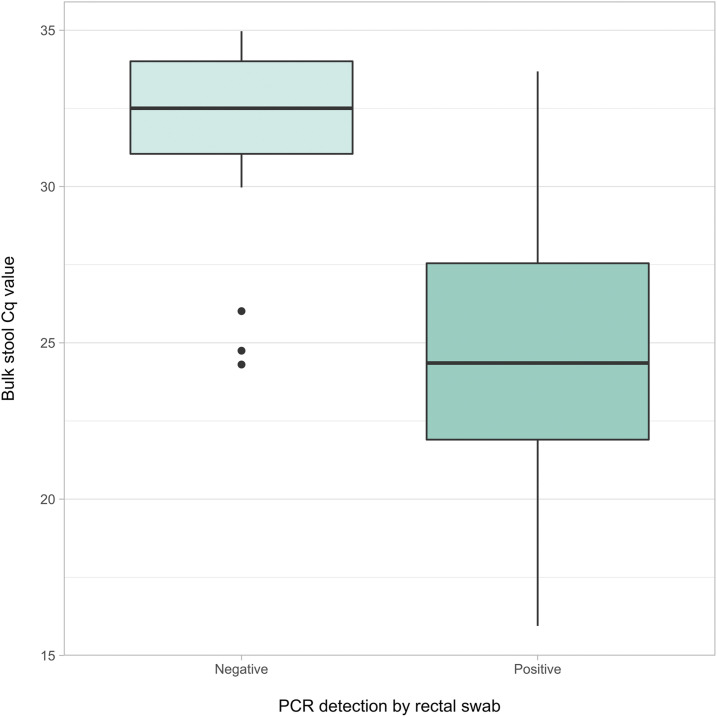
Figure 3.
Median quantitation cycle (Cq) values in bulk stool samples with corresponding qPCR-positive and qPCR-negative rectal swabs. Boxplot depicts median, upper quartile, and lower quartile Cq values of bulk stool samples with matched rectal swabs that were positive for Giardia duodenalis (N = 34) and negative (N = 21). Data represent the first replicate group for both specimen types. Outliers were observed among qPCR-negative rectal swabs only (represented by points). This figure appears in color at www.ajtmh.org.

