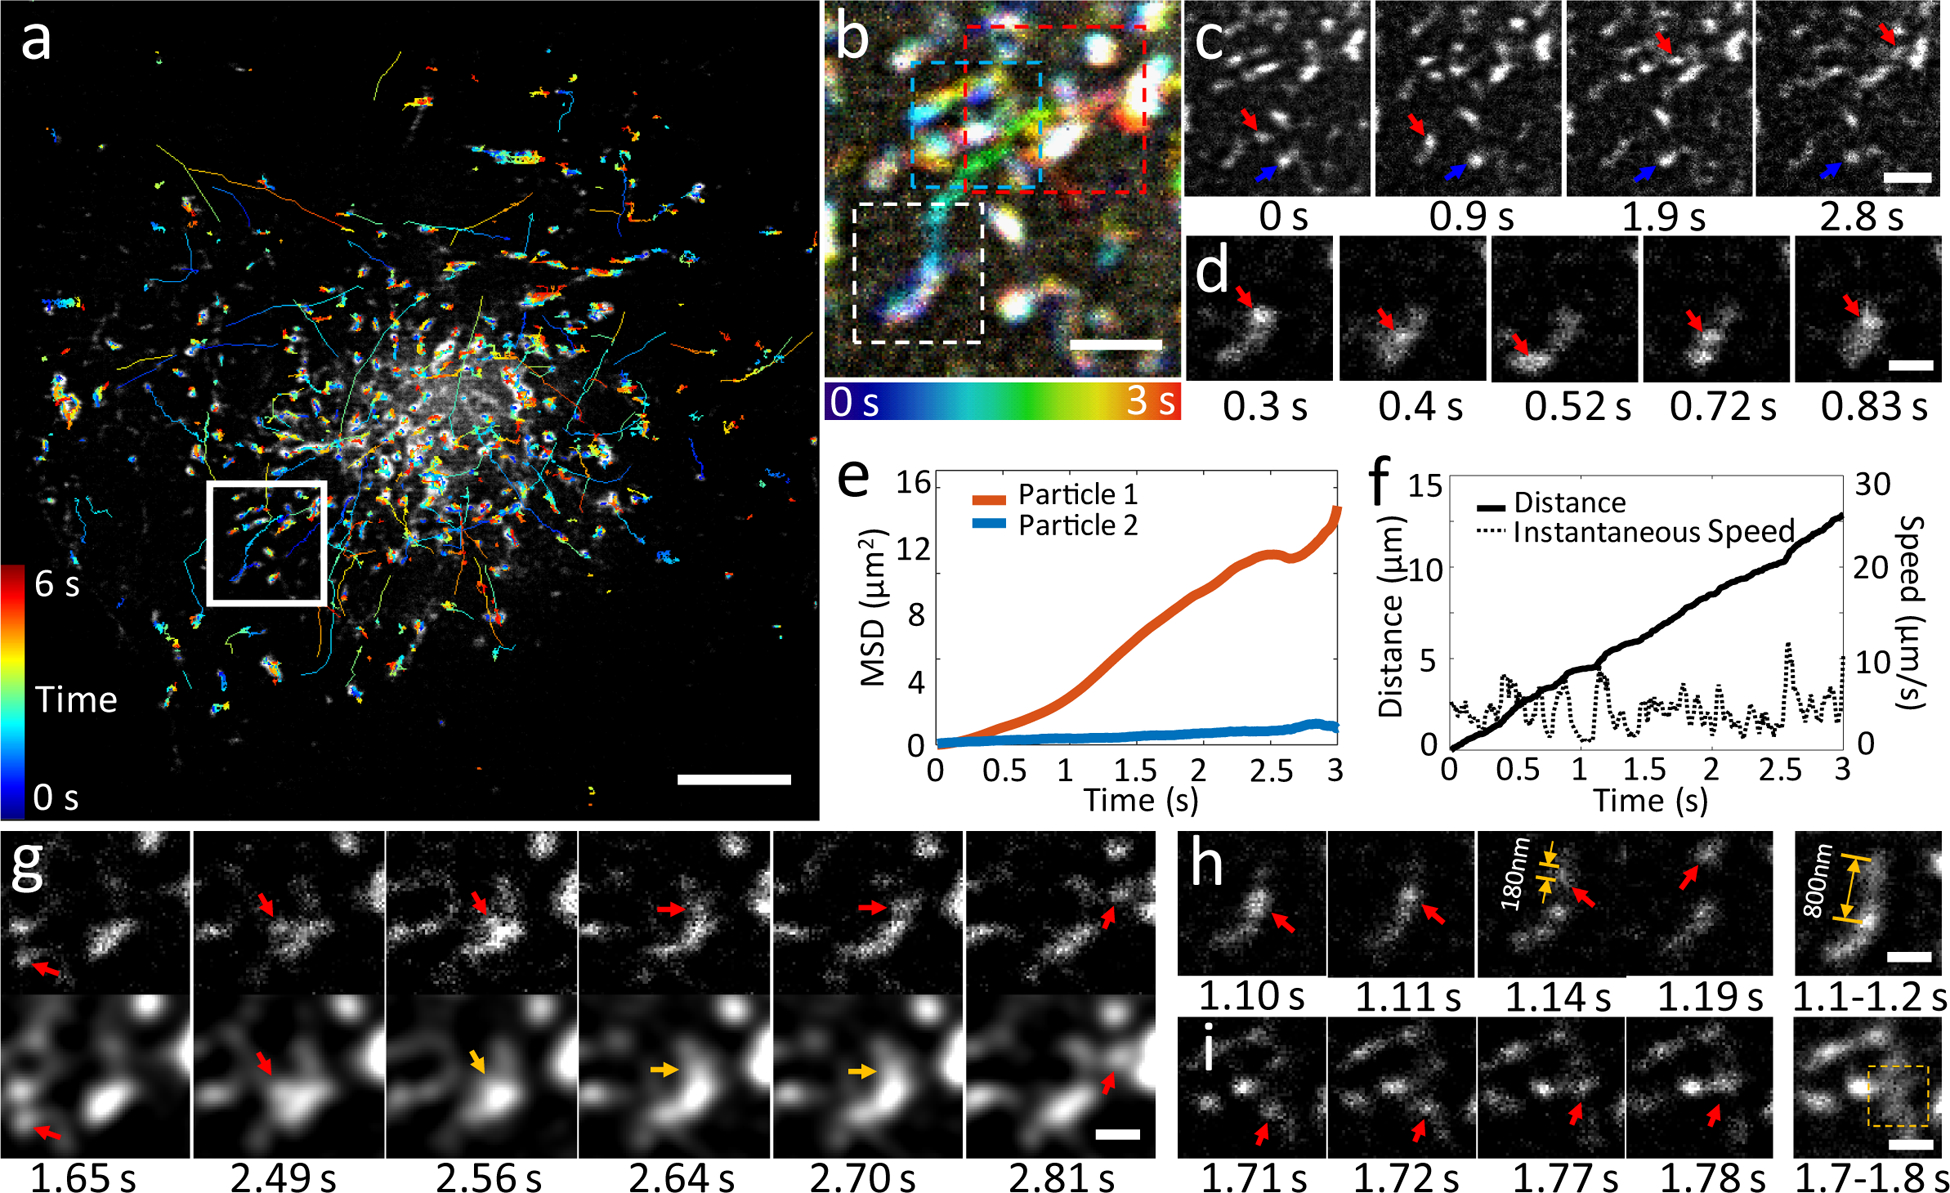
Fig. 3, Rapid dynamics of Rab11 are resolved at 100 Hz with instant TIRF-SIM.

EGFP-Rab11 was transfected into U2OS cells and imaged at 37°C at 100 Hz. a) First frame from image series, with overlaid tracks (lines colored to indicate time, color bar indicated at left). b) Higher magnification view of white rectangular region in a), over the first 3 seconds of acquisition. Time evolution indicated in color bar at bottom. c) Selected images corresponding to region in b), emphasizing motile (red arrow) and more stationary (blue arrow) particle. d) Magnified view of more motile particle indicated with red arrow in c) (white dashed rectangular region in b) highlighting bidirectional motion. Mean square displacements of both particles (e) and distance and instantaneous speed (f) of the motile particle are also quantified. g) Selected images corresponding to red dashed rectangular region in b). Particle, highlighted by arrows, is resolved in instant TIRF-SIM (top row) but poorly or not (yellow arrows) resolved in spatially blurred images (bottom row) that simulate diffraction-limited TIRFM. h) Selected images corresponding to white dashed rectangular region in b), demonstrating that recording at fast 5 ms exposures resolves particles (red arrows), but combining frames into 100 ms bins does not (particle of size ~180 nm is blurred into extended structure of length ~800 nm) i) Same analysis as in h (compare particle indicated by red arrows in left images to yellow dashed region in right-hand image), but particle and region correspond to cyan dashed region in b). Scale bars: 5 μm in a; 1 μm in b, c; 0.5 μm in d, g, h, i. See also Supplementary Fig. 12, 13 and Supplementary Videos 11–14. Experiments were repeated at least 4 times with similar results; representative data are shown.
