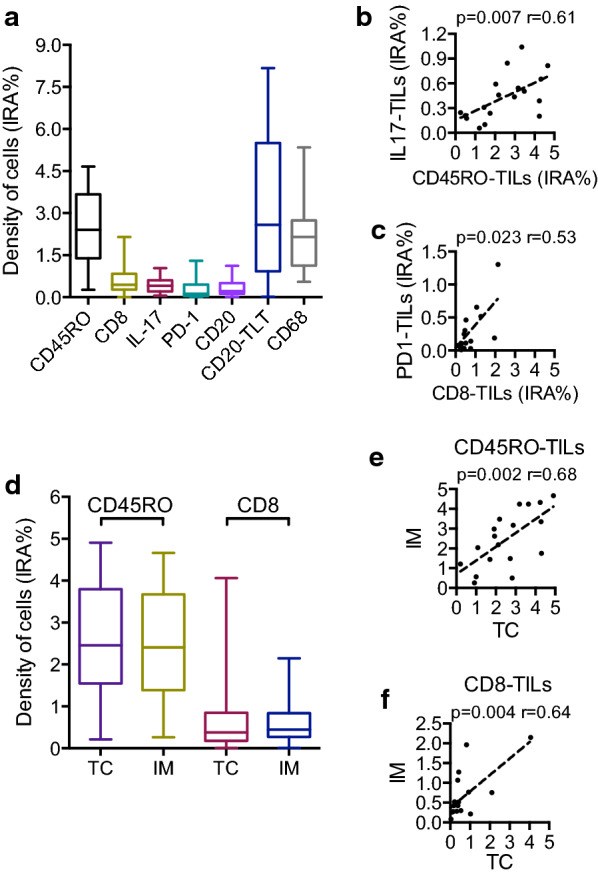
Fig. 2.

Distribution of immune cells in duodenal cancer specimens. a Density (IRA%, percentage of immunoreactive area) of immune cells at the invasive margin (n = 18). b Correlation between density (IRA%) of CD45RO-TILs and IL17+ cells at the invasive margin (n = 18; r = 0.61; p = 0.007 by Spearman analysis). c Correlation between density (IRA %) of CD8-TILs and PD1-TILs at the invasive margin (n = 18; r = 0.53; p = 0.023 by Spearman analysis). d Comparison between density (IRA%) of CD45RO-TILs and CD8-TILs in the tumor core (TC) and at the invasive margin (IM) (n = 18; p = ns by Mann–Whitney). e, f Correlation between density of immune cell infiltration at invasive margin (IM) and tumor core (TC) of CD45RO-TILs (n = 18, r = 0.68; p = 0.002 by Spearman analysis) (e) and CD8-TILs (f) (n = 18, r = 0.64; p = 0.004 by Spearman analysis)
