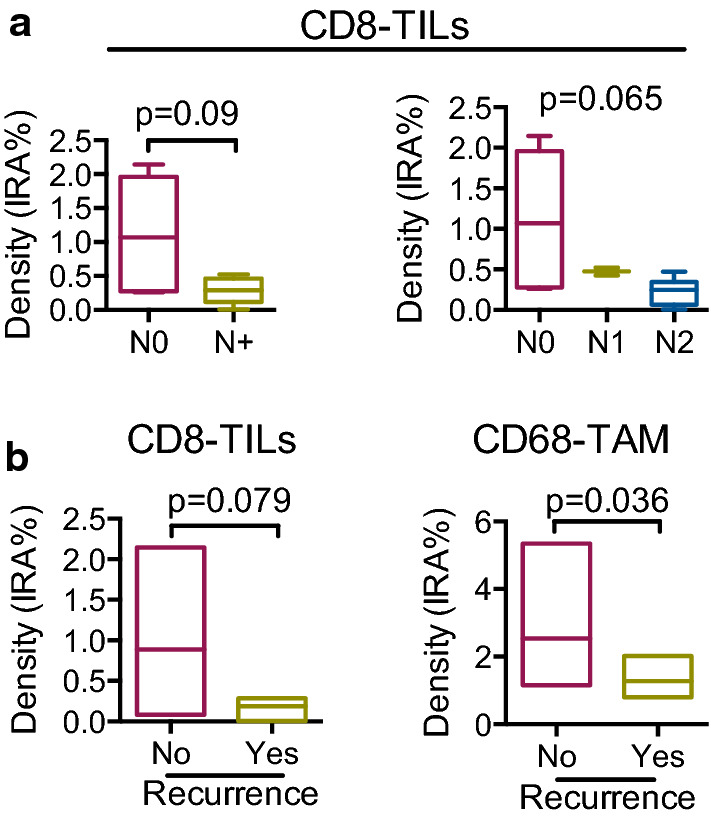
Fig. 4.

Correlation of immune cell density with clinical variables. a, left Density (IRA %) of CD8-TILs according to presence (N+ ; n = 8) or not (N0; n = 7) of metastatic lymphnodes (p = 0.093 by Mann–Whitney). a, right Density (IRA %) of CD8-TILs according to N stage (N0: no lymph nodes, n = 7; N1: 1 metastatic lymph node, n = 2; N2, more than 1 metastatic lymph node, n = 6; p = 0.064 by Kruskal–Wallis). b Density (IRA %) of CD8-TILs (left) in patients with recurrence (n = 3) and no recurrence (n = 9; p = 0.09 by Mann–Whitney) and density (IRA %) of CD68-TAMs (right) in patients with recurrence (n = 3) and no recurrence (n = 9; p = 0.036 by Mann–Whitney)
