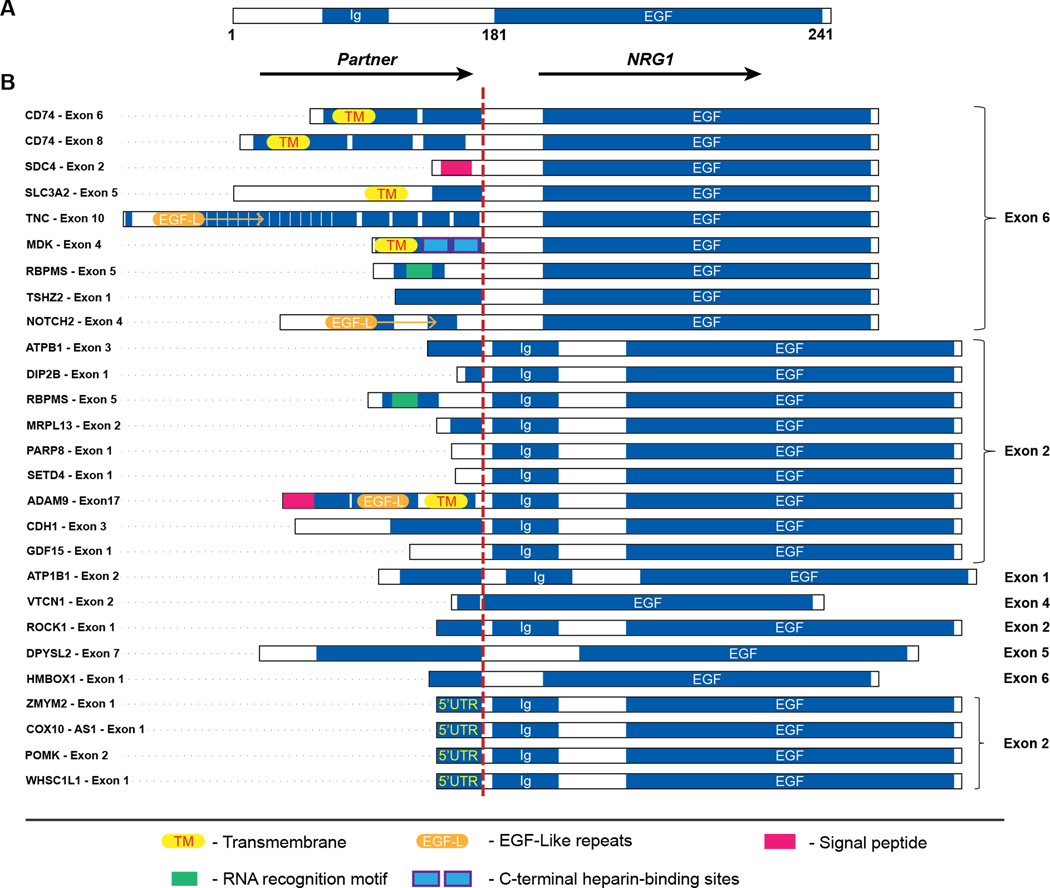
Figure 5.
Schematic diagram of NRG1 fusion variants in solid tumors. A. Genomic structure of wild type NRG1; B. Fusion variants identified with 5’ partners joined to 3’ NRG1. Bars depict the predicted functional domains (not shown to scale) of interest and red dashed line indicates fusion breakpoints. The EGF domain is preserved in all fusion variants.

