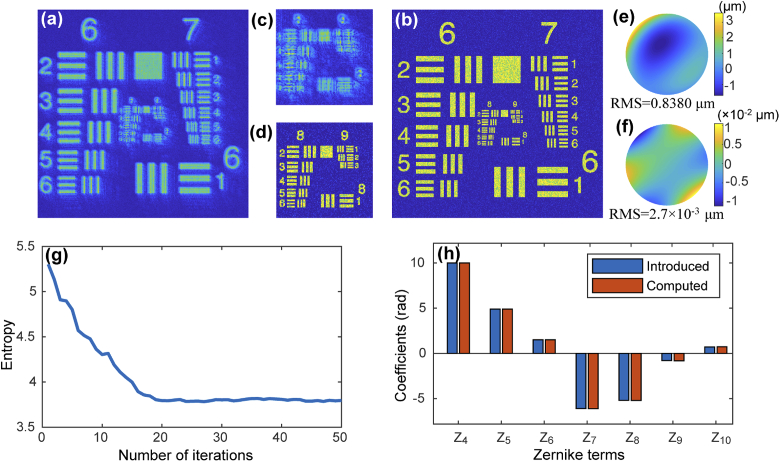
Fig. 3.
(a) Simulated aberrated USAF resolution target image with 3rd-order Zernike polynomials. (b) Corrected image after SPGD-based CAO. (c) and (d) Zoomed-in images of the central region illustrated by white squares in (a) and (b), respectively. (e) Phase map of the introduced 3rd-order aberration distortion. (f) Phase deviation between recovered and introduced wavefront aberration. (g) Image entropy during the correction process. (h) Coefficients of introduced and computed Zernike polynomials.

