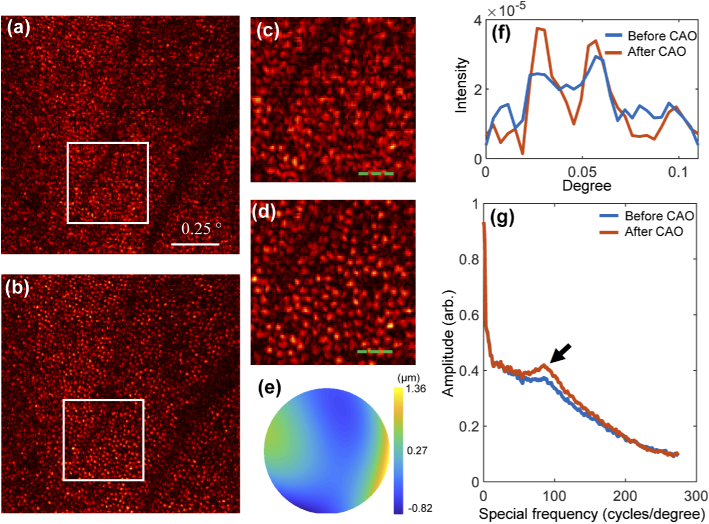
Fig. 8.
Normalized in-vivo images of the cone photoreceptor mosaic in the human retina (a) before and (b) after CAO. (c) and (d) are zoomed-in images of the regions indicated by the white squares in (a) and (b), respectively. (e) Phase map of the computed aberration. (f) 2D line profiles of the photoreceptors indicated by the green dashed lines in (c) and (d). (g) Plots of the radial average power spectra of the original image before CAO (a) and the corrected image after CAO (b). The black arrow indicates an enhanced spatial frequency indicative of Yellott’s ring. The scale bar is .

