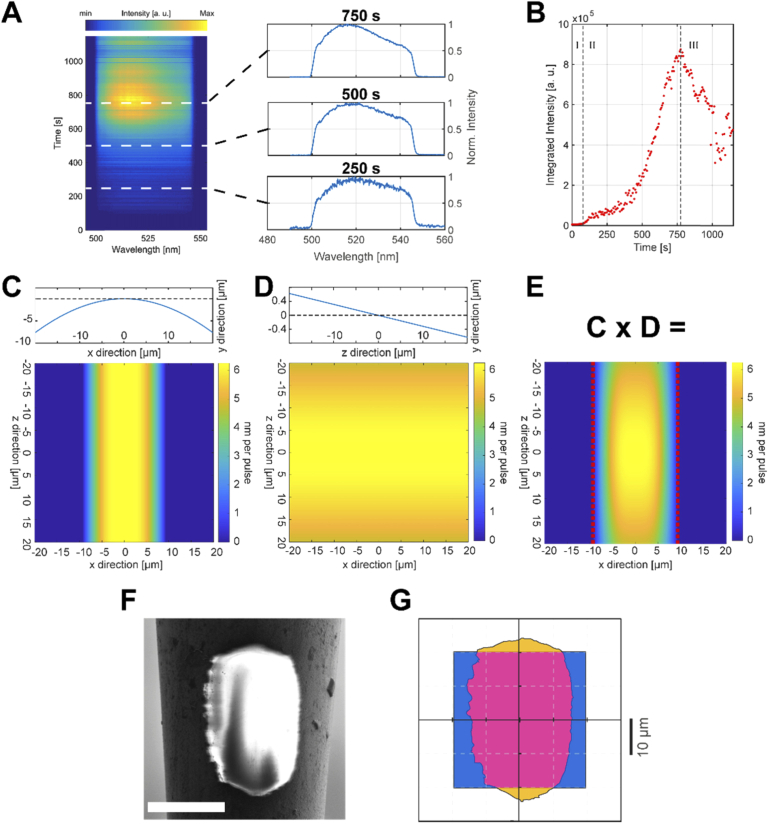
Fig. 2.
(a) Real-time time-resolved fluorescence collection map used as feedback of the ablation process. Inset: three spectra are extracted at different timestamps from the map to better show the spectral shape of the collected signal. Spectra are normalized to the respective maximum value. (b) Scatter plot of the spectra integrated intensity versus time, with the beginning of the process being at t = 0). The dashed lines divide the plot into three different regimes, described in the main text. (c) Ablation depth per pulse dependence from the TF curvature, determined through Eq. (1). (d) Ablation depth per pulse dependence from the axial inclination of the TF, determined throug Eq. (1). (e) Resulting effect on the ablation depth per pulse. Red dashed lines enclose the non-zero ablation depth per pulse region. (f) Scanning Electron Micrograph of a 2PFA-DLW window at a diameter of ∼60 µm. Scale bar is 25 µm. (g) Difference between the Field of View and the final 2PFA-DLW window surface.

