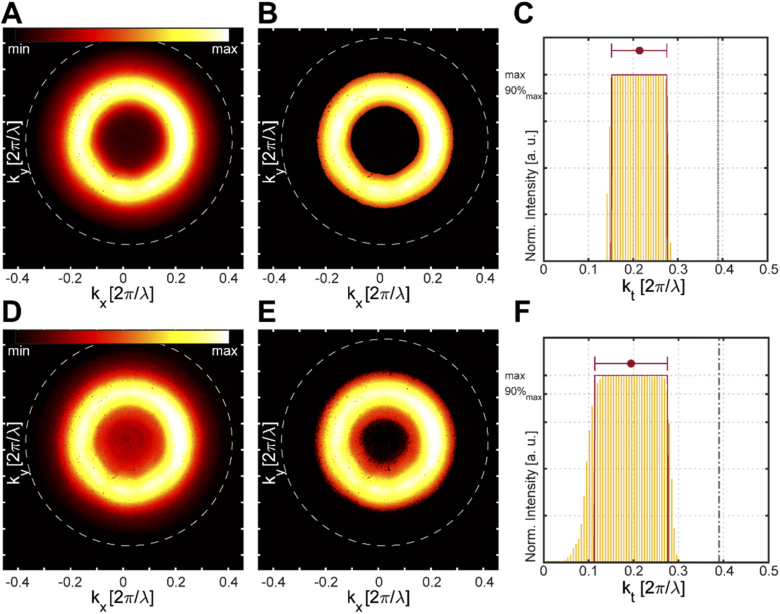
Fig. 5.
(a) “Raw” Far-Field pattern obtained from the subtraction between the signal collected while the fiber is submerged in a PBS:Fluorescein solution drop and the signal collected while the TF is submerged in non-fluorescent PBS. (b) Ring-shaped pattern obtained from the algorithm. (c) (Yellow) Histogram of the distance in units of 2π/λ between the non-zero pixels of the image corrected as described in the main text and the centroid of the image (only a bar each 4 is shown for visibility). Red lines indicate the interval of histogram values greater than the 90% of the maximum. This interval corresponds to the extracted modal subpopulation. The dot-dashed line corresponds to the maximum kt that could be emitted by the fiber (0.39 2π/λ). (d-f) As in A-C for a FIB milled window. White dashed circles the maximum kt that could be emitted by the fiber (0.39 2π/λ).

