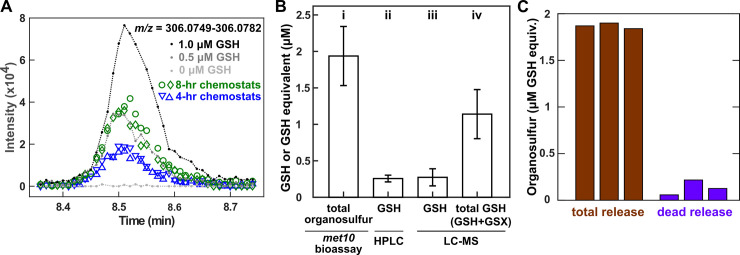
Fig 4. Lysine-limited lys− cells mainly release GSH and GSXs.
Ancestral lys− cells (WY1335) were cultured in lysine-limited chemostats at 8-h doubling time unless otherwise indicated. (A) Mass spectra traces of GSH ion. Gray and black lines correspond to known quantities of GSH added to fresh growth media. Blue and green correspond to filtered supernatants harvested at approximately 48 hours from chemostats at 4-hour and 8-hour doubling time, respectively, with different symbols denoting replicate chemostats. Plotted data are provided as S2 Data. (B) GSH and GSXs constitute the majority of the organosulfur niche. Supernatants were harvested at steady state cell density (approximately 26 hours) and filtered. (i) Bioassay quantification of total organosulfur was performed by comparing the final turbidity of met10− (WY1604) grown in supernatants versus in various known concentrations of GSH. (ii, iii) GSH in supernatant was quantified by HPLC and LC–MS. (iv) GSH + GSX in supernatants were quantified by first reducing GSX to GSH with TCEP and then measuring total GSH via LC–MS. Error bars mark 2 standard deviations of samples from 3 independent chemostats. Plotted data are provided as S4 Data. (C) Organosulfurs are likely released by live cells. Total organosulfur in chemostat supernatant (brown) far exceeded that expected from release by dead cells (purple). Organosulfurs were quantified using the met10 bioassay. To estimate dead-cell release, we measured dead-cell density using flow cytometry (Methods, “Flow cytometry”), and multiplied it with the average amount of organosulfur per cell (Methods, “Metabolite extraction”). Three independent experiments are plotted (S5 Data). GSH, reduced glutathione; GSX, glutathione S-conjugate; HPLC, High-Performance Liquid Chromatography; LC–MS, liquid chromatography–mass spectrometry; met−, methionine-requiring mutant; TCEP, tris(2-carboxyethyl)phosphine.

