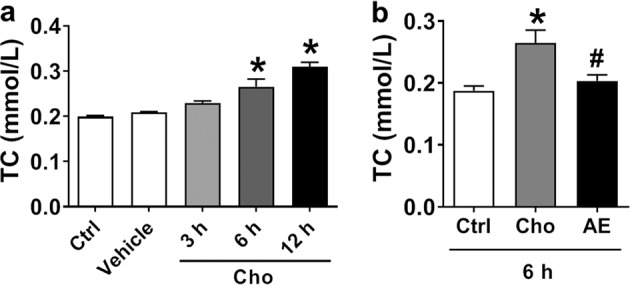
Fig. 3.

Effect of AE on TC in the HepG2 cell line as a cellular model of high cholesterol. a Cholesterol treatment for 3, 6, and 12 h. b Effect of AE (30 μM) on the cholesterol content after treatment for 6 h. *P < 0.05 vs. Ctrl, #P < 0.05 vs. Cho, n = 6
