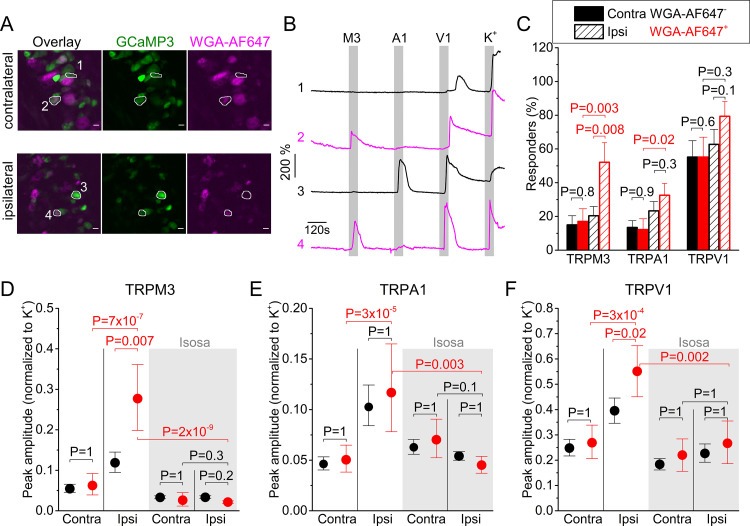
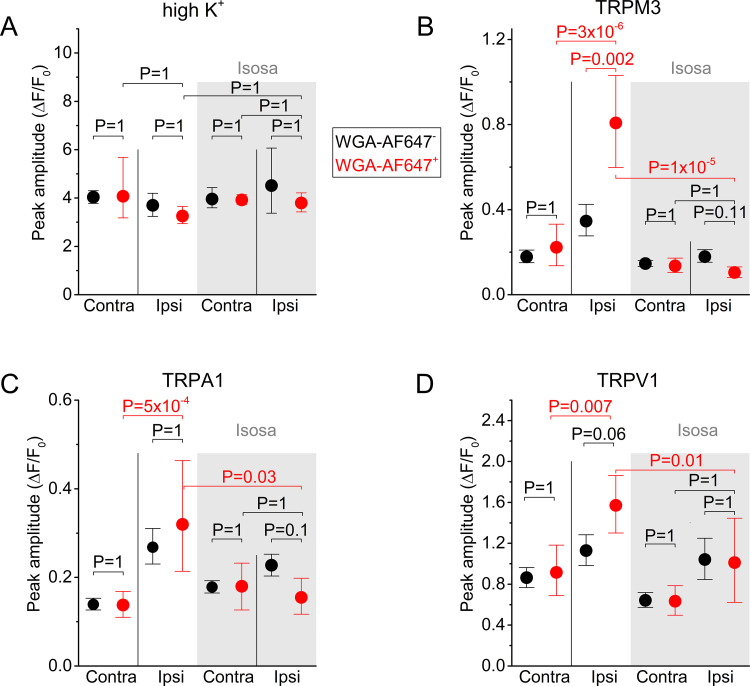
Figure 2. Inflammation-induced changes in TRP channel activity in DRG cell bodies.
(A) Confocal images of the ipsi- and contralateral L5 DRG of a CFA-treated mouse showing GCaMP3 (green) and WGA-AF647 (magenta) fluorescence. (B) Representative examples, corresponding to cells indicated in panel (A) of changes in GCaMP3 fluorescence (ΔF/F0) in response to application of agonists of TRPM3 (PS + CIM0216; M3) TRPA1 (MO; A1) and TRPV1 (capsaicin; V1) and of a depolarizing high K+ solution (K+). (C) Percentage of neurons responding to the indicated agonists in WGA-AF647+ (red) and WGA-AF647- (black) DRG neurons from the ipsi- and contralateral sides. Data are shown as mean ± SEM from 9 mice. Statistical comparisons between groups were made using one-way ANOVA with Holm–Šidák post-hoc test. Cells that did not respond to high K+ stimulation were excluded from the analysis. (D-F) Peak amplitudes of responses to the TRPM3, TRPA1 and TRPA1 agonists, normalized to the response to the depolarizing high K+ solution, comparing retrogradely labeled (WGA-AF647+; red) and unlabeled (WGA-AF647-; black) neurons on the ipsi- and contralateral side. Where indicated (grey background), DRGs were pre-incubated with isosakuranetin (20 μM). Values are presented as mean along with the 95% confidence interval. The data of the individual cells and the number of cells in the different groups are shown in Figure 2—figure supplement 2. A comparison of the non-normalized data is provided in Figure 2—figure supplement 3. Statistical comparisons between groups were made using Kruskal-Wallis ANOVA with Dunn’s posthoc test. Data are from 9 mice in the absence of isosakuranetin and another set of 9 mice in the presence of isosakuranetin.
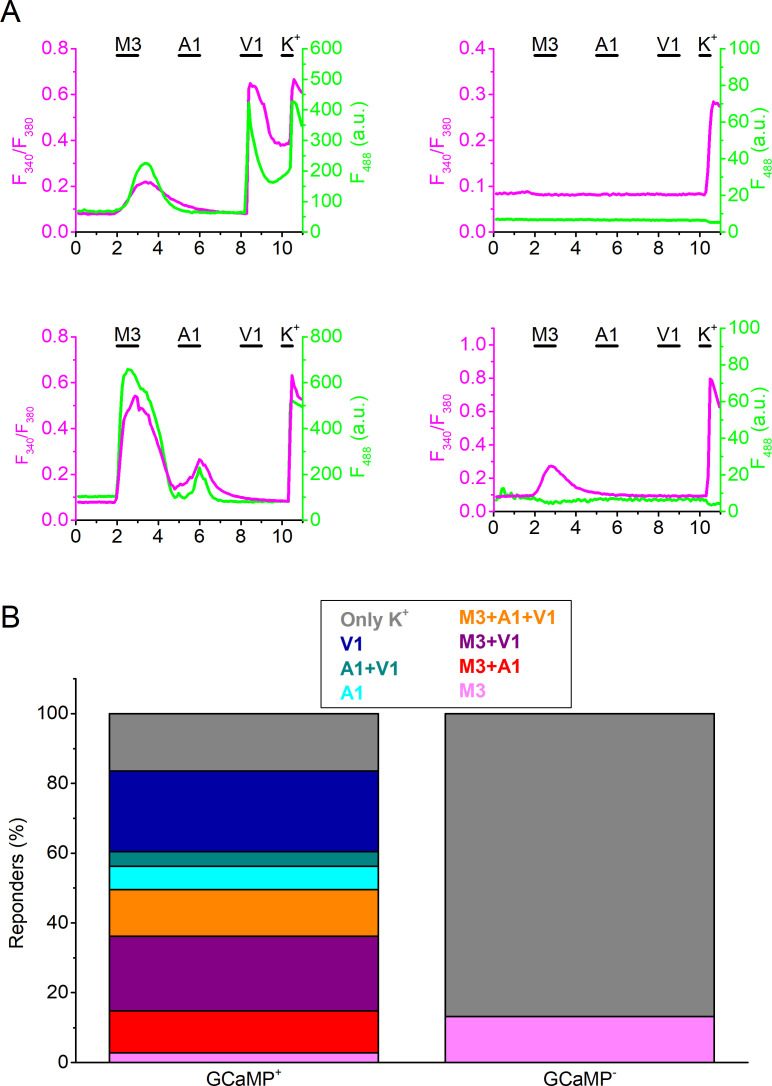
Figure 2—figure supplement 1. Combined GCaMP3- and Fura-2-based calcium imaging in isolated DRG neurons from TRPV1-GCaMP3 mice.
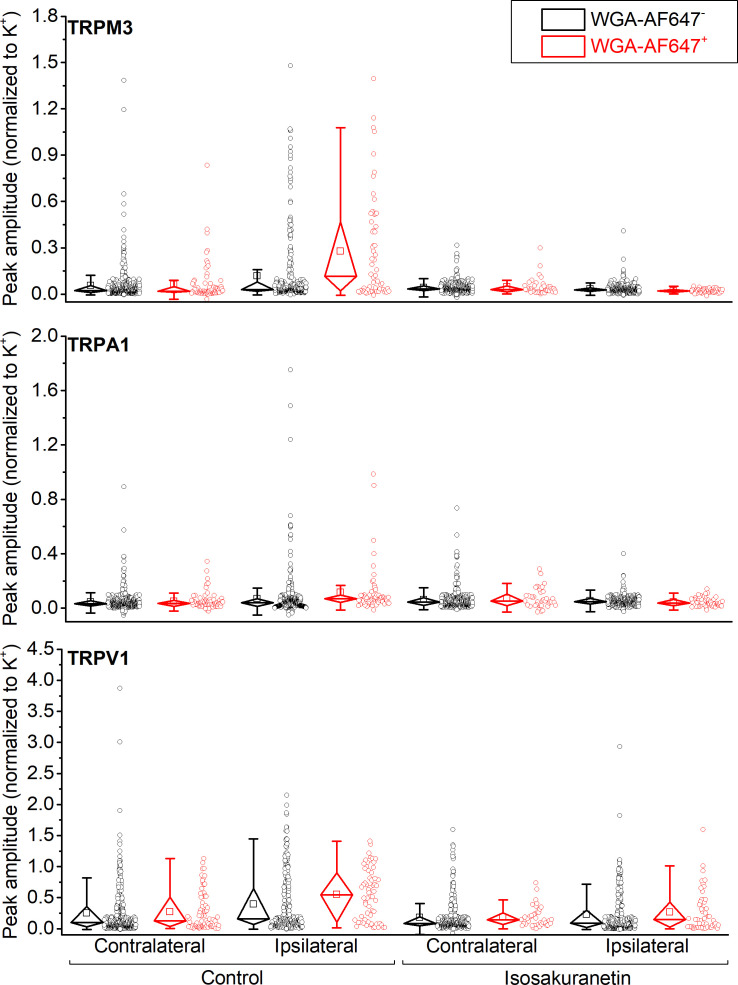
Figure 2—figure supplement 2. Individual data points underlying the values shown in Figure 2D–F are displayed, along with box plots showing the median, first and third quartiles, whiskers showing the 5th and 95th percentiles, and open squares indicating the means.
Figure 2—figure supplement 3. Non-normalized GCaMP3 responses.
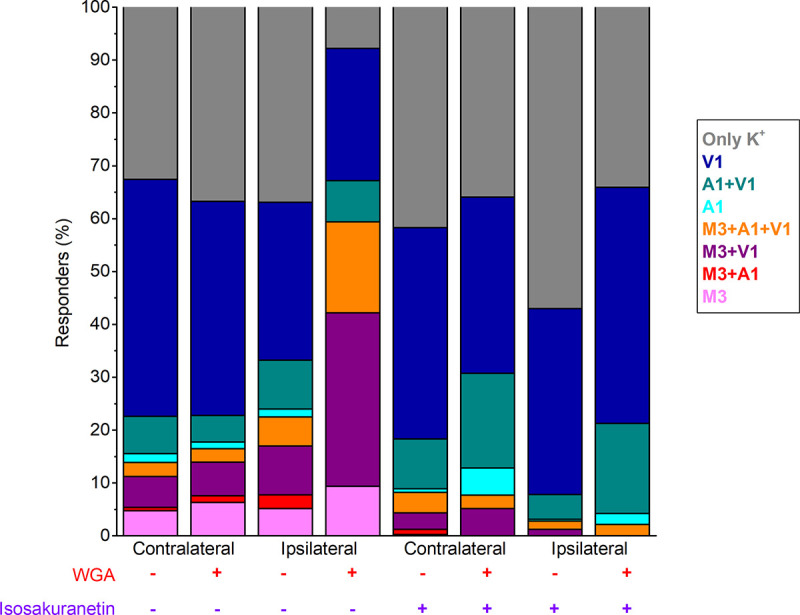
Figure 2—figure supplement 4. Percentage of the total imaged neurons responding to the indicated (combinations of) agonists in the contra- and ipsilateral DRG, both in control and following incubation with isosakuranetin (20 µM).
