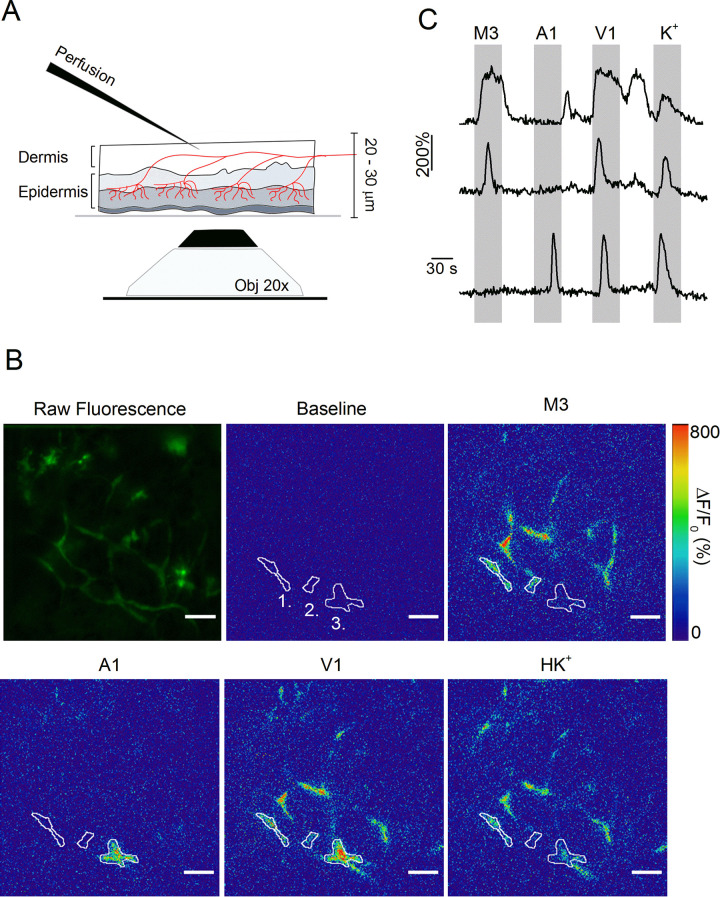
Figure 3. Optical measurement of TRP channel activity in peripheral sensory nerve endings.
(A) Schematic illustration of the optical imaging setup. Sensory nerve fibers (red) innervating the dermal and epidermal skin layers are visualized using 488 nm laser light and an inverted spinning disk confocal microscope (20x objective). To avoid the barrier effect of the epidermis, solutions (at 37°C) were applied to the internal side of the sample from above. A total thickness of 20–30 μm was captured. (B) The first image depicts the summed raw fluorescence of the entire imaging experiment. The next five images represent normalized fluorescence (ΔF/F0) at baseline (before the first stimulus), upon stimulation with TRPM3, TRPA1 and TRPV1 agonists, and with the depolarizing high K+ solutions. Three automatically detected ROIs, corresponding to the traces in panel C, are indicated. Scale bar is 50 μm. See Figure 3—Video 1. (C) Time course of normalized GCaMP3 fluorescence (F/F0) from three different ROIs (top: ROI 1; middle: ROI 2; bottom: ROI 3) depicted in panel B, with indication of the application periods of TRP channel agonists.

