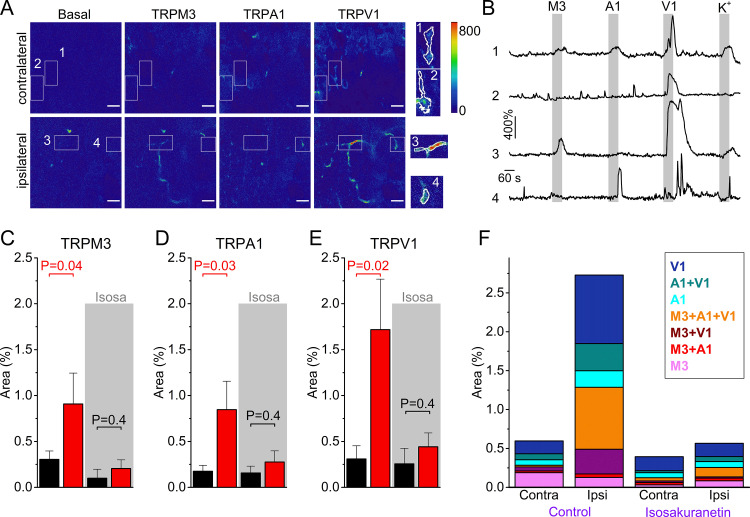
Figure 4. Increased TRPM3 activity in peripheral sensory nerve endings during inflammation.
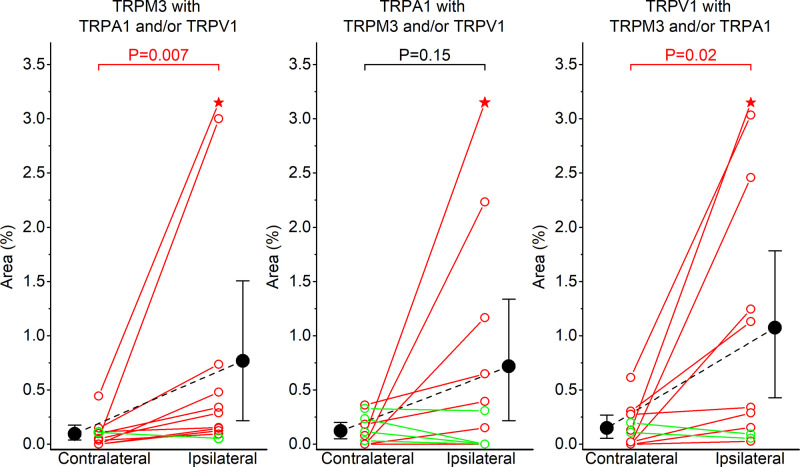
(A) Normalized fluorescence at baseline (before the first stimulus), and upon stimulation with TRPM3, TRPA1 and TRPV1 agonists of the ipsi- and contralateral skin of a CFA-treated mouse. Scale bar is 50 μm. Boxed areas, magnified on the right, illustrate automatically detected ROIs. (B) GCaMP3 fluorescence, expressed as ΔF/F0, for the ROIs indicated in panel (A). (C-E) Responsive areas to the indicated agonists in the contralateral (black) and ipsilateral (red) skin. The paired Wilcoxon Signed Rank Test was used for a paired comparison of the responsive area in the ipsi- and contralateral paw skin of 11 mice, measured in the absence of isosakuranetin. The ipsi- and contralateral skin of another set of 6 mice was compared following pre-incubation with isosakuranetin (20 μM; grey background). Since the control and isosakuranetin-treated skin preparations originate from different mice, and considering the substantial inter-animal variability in skin thickness and innervation, a full statistical comparison between these data sets was not performed. (F) Percentage of the total imaged area responding to the indicated (combinations of) agonists in the contra- and ipsilateral paws, and following isosakuranetin pre-incubation. Further statistical comparison is provided in Figure 4—figure supplement 1.


