. 2020 Jul 3;9:e56427. doi: 10.7554/eLife.56427

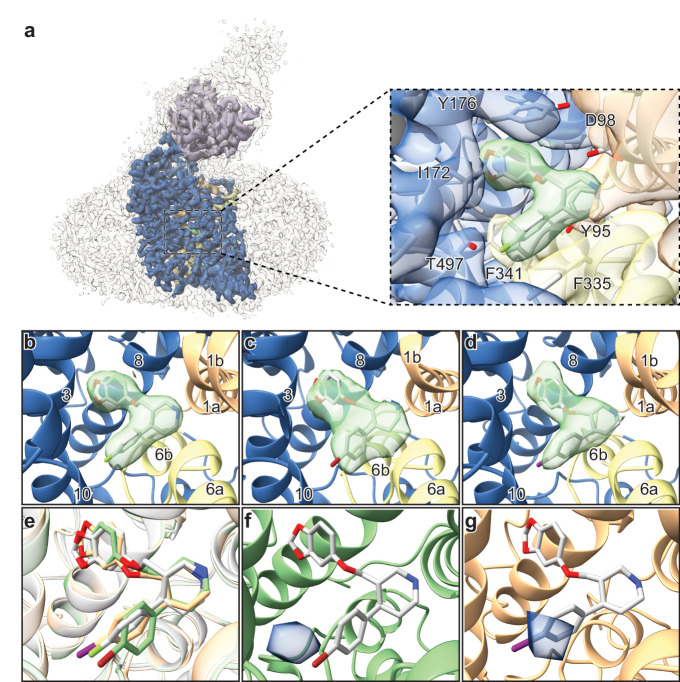
Figure 4. Structures of SERT-paroxetine complexes.

(a) Cryo-EM reconstruction of SERT bound to paroxetine where the shape of the SERT-8B6 Fab complex and detergent micelle is shown in transparent light grey. The density of SERT is shown in dark blue with TM1 and TM6 colored in orange and yellow, respectively, and the density for paroxetine in green. The variable domain of the 8B6 Fab is colored in purple. Inset shows the density features at the central site of paroxetine. (b) Density feature at the central site of paroxetine. (c) Density feature at the central site of Br-paroxetine. (d) Density feature at the central site of I-paroxetine. (e) Comparison of the binding poses of paroxetine (grey), Br-paroxetine (green), and I-paroxetine (orange). (f) Anomalous difference electron density (blue) derived from Br-paroxetine, contoured at 5.2σ. g, Anomalous difference electron density (blue) derived from I-paroxetine, contoured at 4.3σ.

Figure 4.

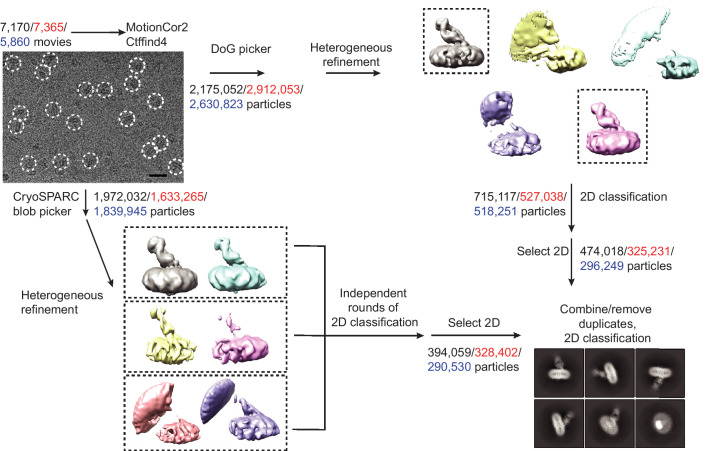
Figure 4—figure supplement 1. Work-flow of cryo-EM data processing of ΔN72/ΔC13 SERT/8B6 Fab/paroxetine complexes.

Figure 4—figure supplement 1.

A representative zoomed, motion-corrected micrograph with individual single particles circled in white. Bar equals 20 nm. Motion-correction and CTF estimation was performed using MotionCor2 and Ctffind4. The number of movies/particles collected for each data set are shown in black (paroxetine), red (Br-paroxetine), and blue (I-paroxetine). After particle picking using either DoG picker or the blob picker in cryoSPARC, particles were sorted using heterogeneous refinement in cryoSPARC followed by 2D classification. For the DoG-picked particles, 3D classes containing SERT-Fab features (boxed) were combined and subjected to 2D classification. For cryoSPARC-picked particles, heterogeneous refinement was also used to initially sort particles in cryoSPARC. Classes with similar features (boxed) were combined, subjected to three independent 2D classifications, and 2D classes containing SERT-Fab features were combined. Particles picked by both methods were combined and duplicate particle-picks were removed in RELION (particle picks that are less than 100 Å of one another were considered duplicates).

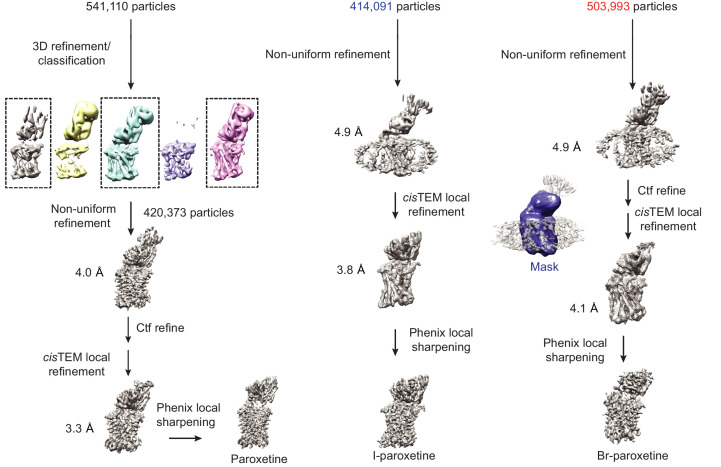
Figure 4—figure supplement 2. 3D refinement of ΔN72/ΔC13 SERT/8B6 Fab/paroxetine complexes.

Figure 4—figure supplement 2.

For the paroxetine complex, 3D refinement was performed in RELION followed by 3D classification without alignment and a mask which isolated SERT and Fab. 3D classification was not performed on the Br-paroxetine and I-paroxetine particles. Particles were further refined using non-uniform refinement in cryoSPARC, followed by local refinement in cisTEM with a mask which isolated SERT and the Fab variable domain and removed the Fab constant domain and micelle (mask is shown overlaid in blue on top of the Br-paroxetine reconstruction). The final reconstructed volume was sharpened using Phenix local sharpening.

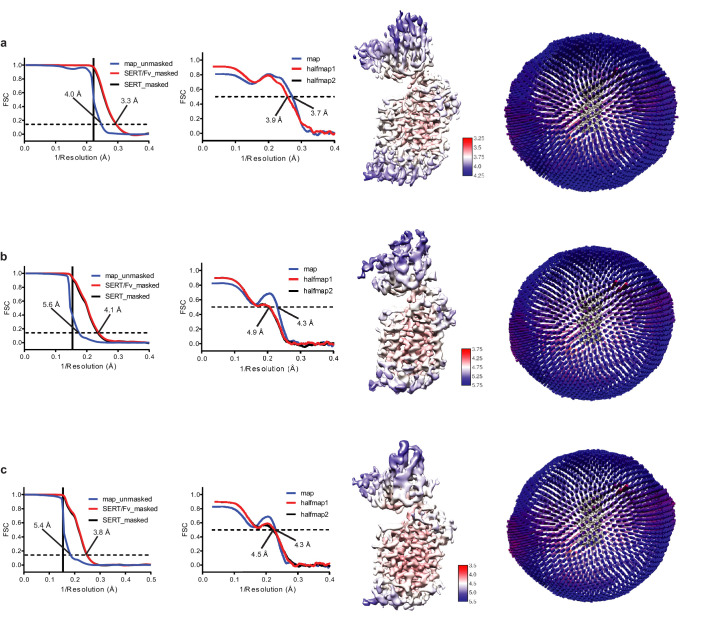
Figure 4—figure supplement 3. Cryo-EM reconstruction of ΔN72/ΔC13 SERT/8B6 Fab/paroxetine complexes.

Figure 4—figure supplement 3.

(a) Reconstruction of SERT-8B6 paroxetine complex. Left panel, FSC curves for cross-validation, the final map (blue), masked SERT-Fv (red), and a mask which isolated SERT (black). The high-resolution limit cutoff for refinement was 4.5 Å. Middle left panel: model vs. half map 1 (working, red), half map 2 (free, black), model vs. final map (blue). Middle right panel: cryo-EM density map colored by local resolution estimation. Right panel: the angular distribution of particles used in the final reconstruction. (b) Reconstruction of the SERT-8B6 Br-paroxetine complex. The high-resolution limit cutoff for refinement was 6.5 Å. (c) Reconstruction of the SERT-8B6 I-paroxetine complex. The high-resolution limit cutoff for refinement was 6.5 Å.

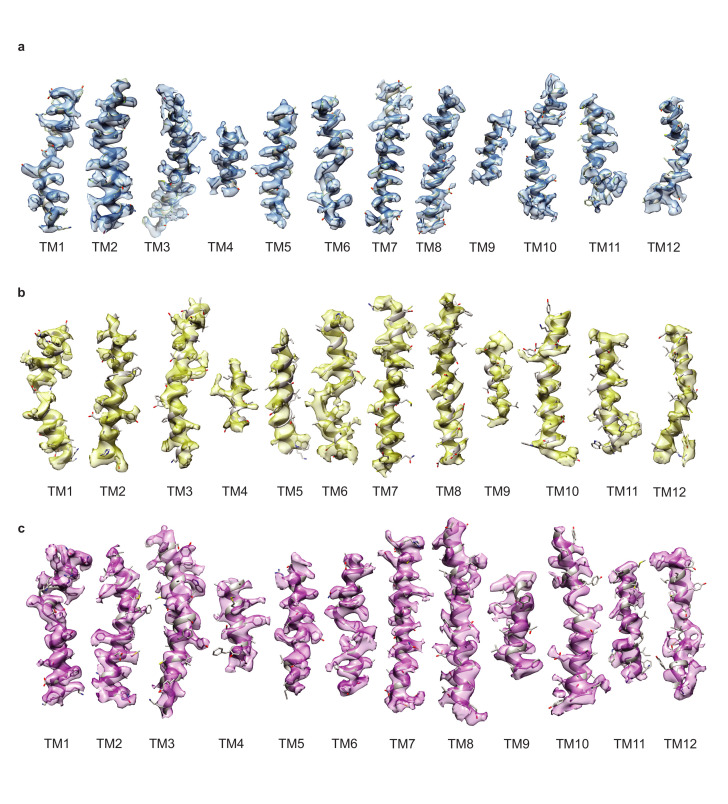
Figure 4—figure supplement 4. Cryo-EM density segments of the transmembrane helices.

Figure 4—figure supplement 4.

(a) Density of TM1-12 of the paroxetine reconstruction, shown in blue. (b) Density of TM1-12 of the Br-paroxetine reconstruction, shown in yellow. (c) Density of TM1-12 of the I-paroxetine reconstruction, shown in purple.

Figure 4—figure supplement 5. Comparison of the fit of paroxetine in the ABC and ACB poses.
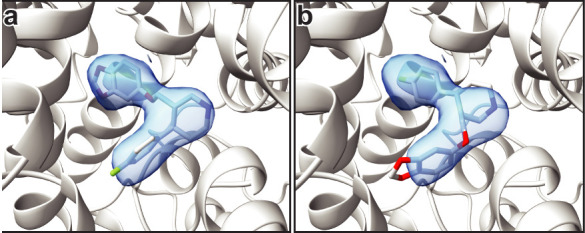
Figure 4—figure supplement 5.

(a) Shows the fit of paroxetine to the cryo-EM density in the ABC pose. (b) Shows the fit in the ACB pose.

Figure 4—figure supplement 6. Isomorphous difference densities at the central site.

Figure 4—figure supplement 6.

(a) A negative difference density feature (red mesh, 4σ) was observed in subsite C for the Fo(paroxetine)-Fo(Br-paroxetine) map. (b) A negative difference density feature (red mesh, 3.5σ) was observed in subsite C for the Fo(paroxetine)-Fo(I-paroxetine) map. (c) No significant difference densities for the Fo(Br-paroxetine)-Fo(I-paroxetine) map was observed at 3.5σ (shown).