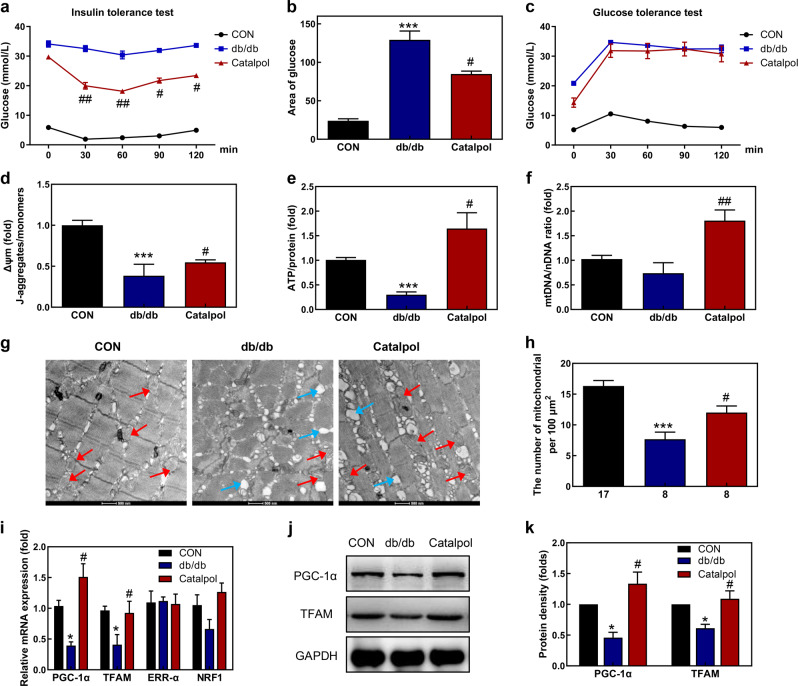
Fig. 1. Catalpol increases mitochondrial biogenesis in db/db mice.
a The insulin tolerance results and b the areas under the curves (AUCs) for the insulin tolerance test are shown. c The glucose tolerance results from the glucose tolerance test are shown. d Mitochondrial membrane potential, e ATP production, and f mtDNA copy number were determined in the TA muscle of db/db mice. g Representative electron micrographs of mitochondria in the TA muscle. Red arrowheads: mitochondria; blue arrowheads: lipid droplets. Scale bar, 500 nm. h The number of mitochondria calculated using Innerview 2.0 software (Lumenera). i The relative mRNA levels of PGC-1α, TFAM, ERR-α, and NRF1 measured by RT-qPCR. GAPDH served as the control housekeeping gene. j, k PGC-1α and TFAM protein levels in mouse TA muscle measured by Western blot analysis. The data are expressed as the means ± SD (n = 8 animals), *P < 0.05, ***P < 0.001 vs. control mice; #P < 0.05, ##P < 0.01 vs. db/db mice.

