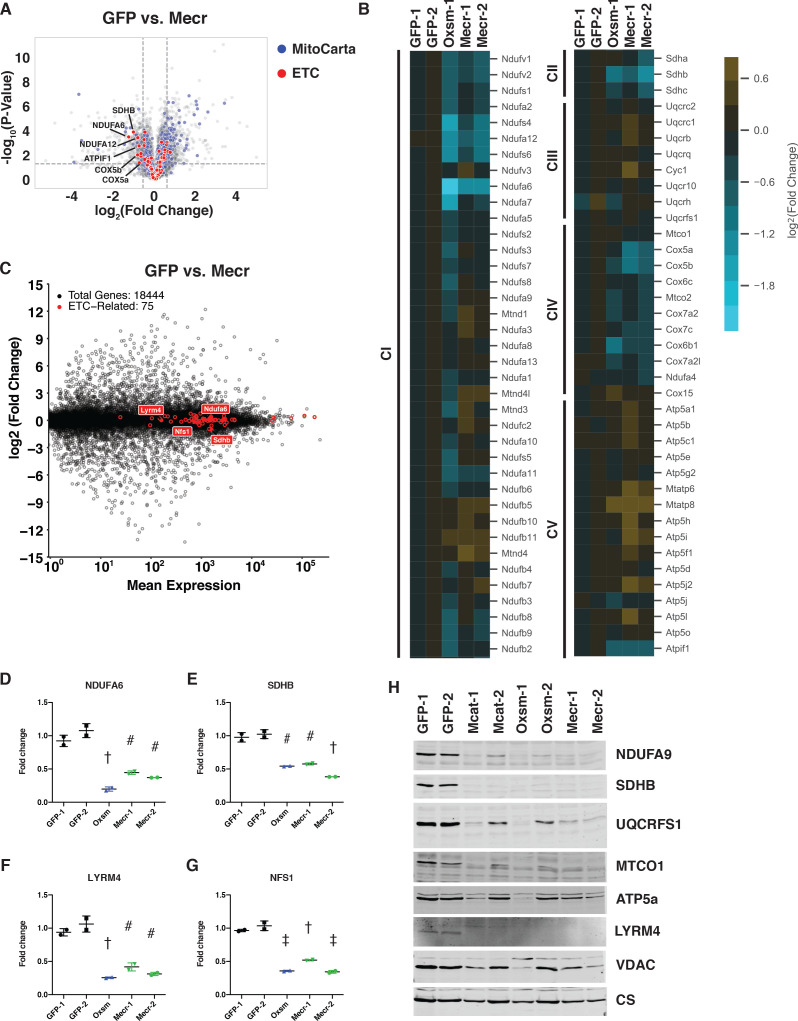
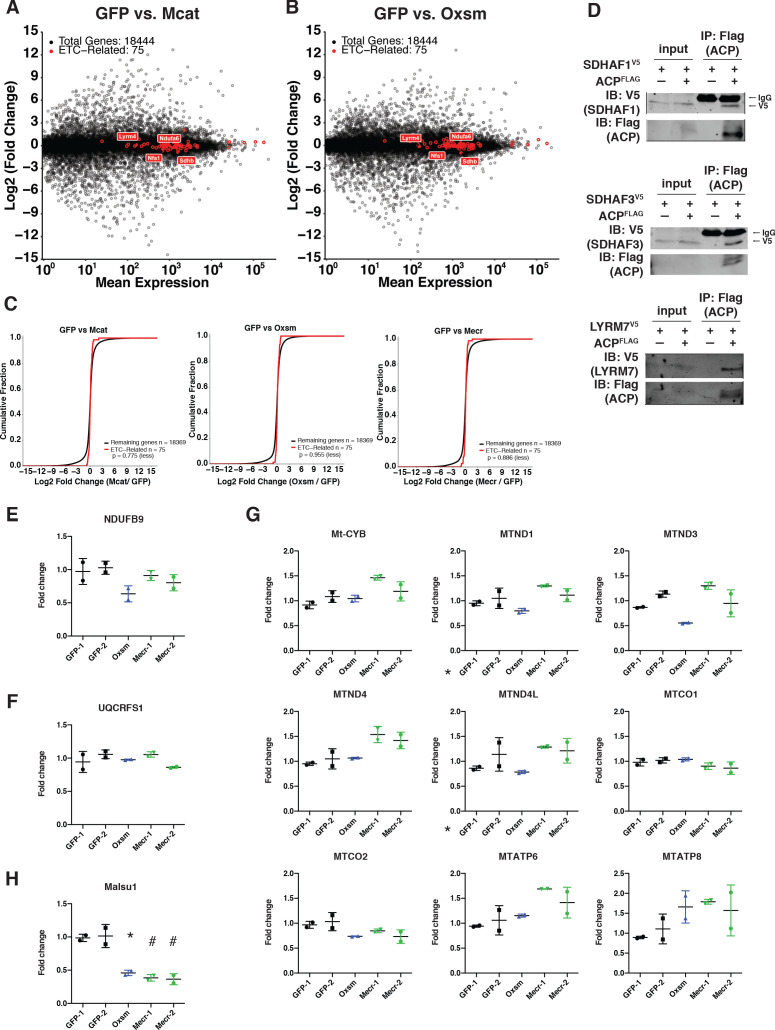
Figure 3. Posttranslational loss of ETC components in mtFAS mutants is specific to LYR proteins and their targets.
(A-B) Duplicate samples from the indicated cell lines were grown under proliferative conditions and subjected to TMT labeling and quantitative proteomics analysis. (A) Volcano plot of compiled Mecr clones vs. GFP controls showing all proteins (gray), mitochondrial proteins (blue), and electron transport chain subunits (ETC, red). Dashed gray lines indicate cutoffs for significance at -log10(p-value) = 1.3 and log2(Fold Change) = +/- 0.59. (B) Heatmap depicting log2(Fold Change) of OXPHOS subunits in the indicated cell lines. (C) Quadruplicate samples from mtFAS mutant cells and controls were grown under proliferative conditions. Total RNA was isolated, used as input for mRNA library prep, and sequenced. Resulting data were aligned to the mouse genome and analyzed for differential expression. ETC subunit-encoding transcripts are shown in red vs. all other transcripts (gray). (D-G) Relative abundance of the indicated LYR proteins or their targets in the indicated cell lines from the quantitative proteomics experiment described in (A-B) #=p < 0.01, †=p < 0.001, ‡=p < 0.0001, error bars are SD. All statistical comparisons shown are between mtFAS mutants and GFP-1 clone; p-values when compared with GFP-2 clone were similar or smaller than when compared with GFP-1 clone. (H) Crude mitochondrial lysates generated from the indicated cell lines by differential centrifugation were normalized for total protein by BCA assay, separated by SDS-PAGE, and immunoblotted with the indicated antibodies.


