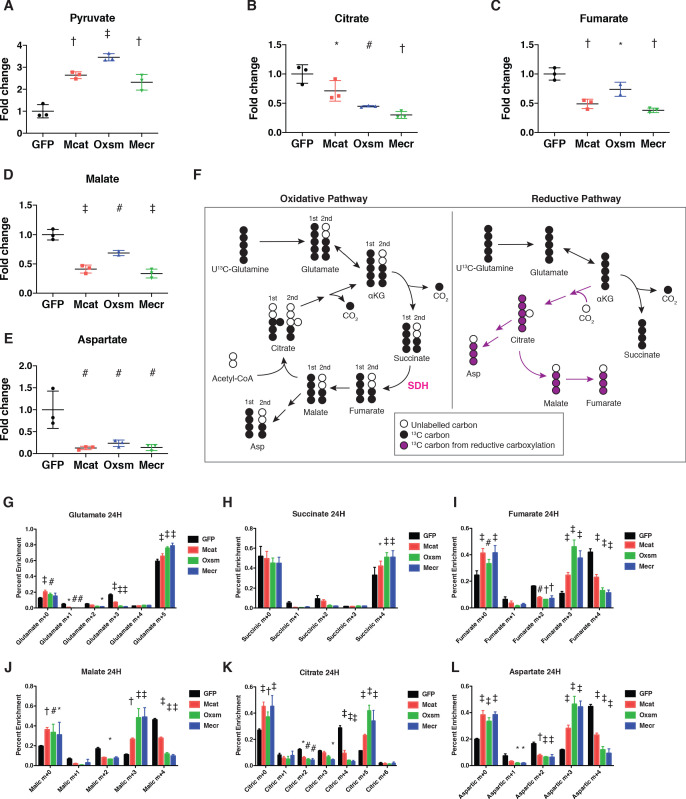
Figure 4. Impairment of mtFAS promotes switch from oxidative to reductive mitochondrial metabolism.
(A–E) Triplicate biological samples from mtFAS mutant cell lines or GFP control were grown under standard proliferative conditions in high glucose medium (25 mM) and harvested for steady-state metabolomics analysis by LC-MS. Shown are relative pool sizes for the indicated metabolites. *=p < 0.05, #=p < 0.01, †=p < 0.001, ‡=p < 0.0001, error bars are SD. (F) Schematic of isotopomeric labeling of TCA cycle intermediates upon feeding with U13C-glutamine. Black circles indicate 13C carbons derived from labeled glutamine via oxidative TCA cycle flux (left). Purple circles indicate 13C carbons derived from labeled glutamine via reductive carboxylation (right). (G-L) Triplicate biological samples of the indicated genotype were labeled for 24 hr with U13C-glutamine, harvested, and analyzed via GC-MS for the indicated metabolites and their isotopologues. *=p < 0.05, #=p < 0.01, †=p < 0.001, ‡=p < 0.0001, error bars are SD.


