
Fig. 1.
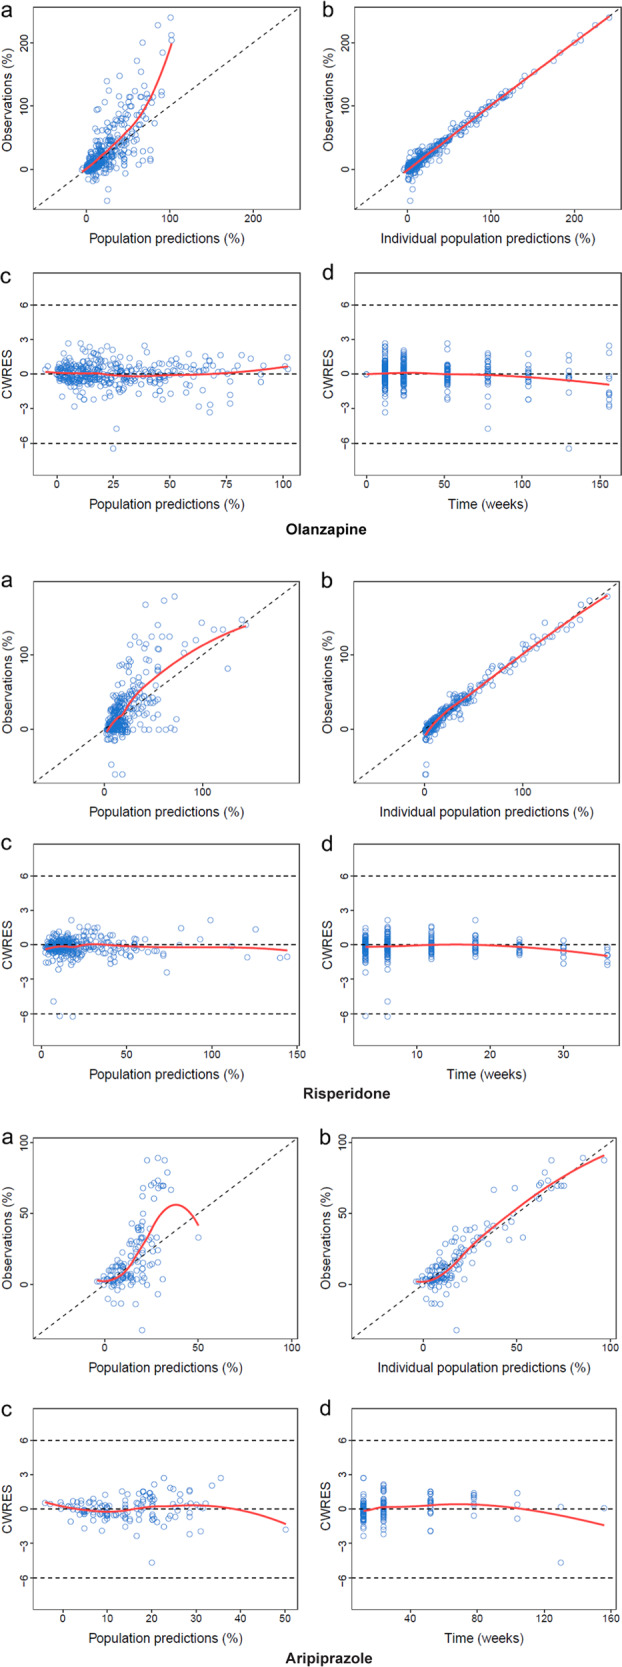
The goodness-of-fit plots for the final models. a Scatter plot of population-predicted effect data (PRED) vs. observed effect data (OBS). b Scatter plot individual predicted effect data (IPRED) vs. OBS. c Plot of conditional weighted residuals (CWRES) vs. PRED. d Plot of CWRES vs. the Time point. The black and red lines in a and b represent identity and regression lines, respectively, whereas in c and d, the black lines are the position where conditional weighted residual equal 0 and the red lines are the regression lines. The goodness-of-fit plots for the aripiprazole are plots after removing the outliers