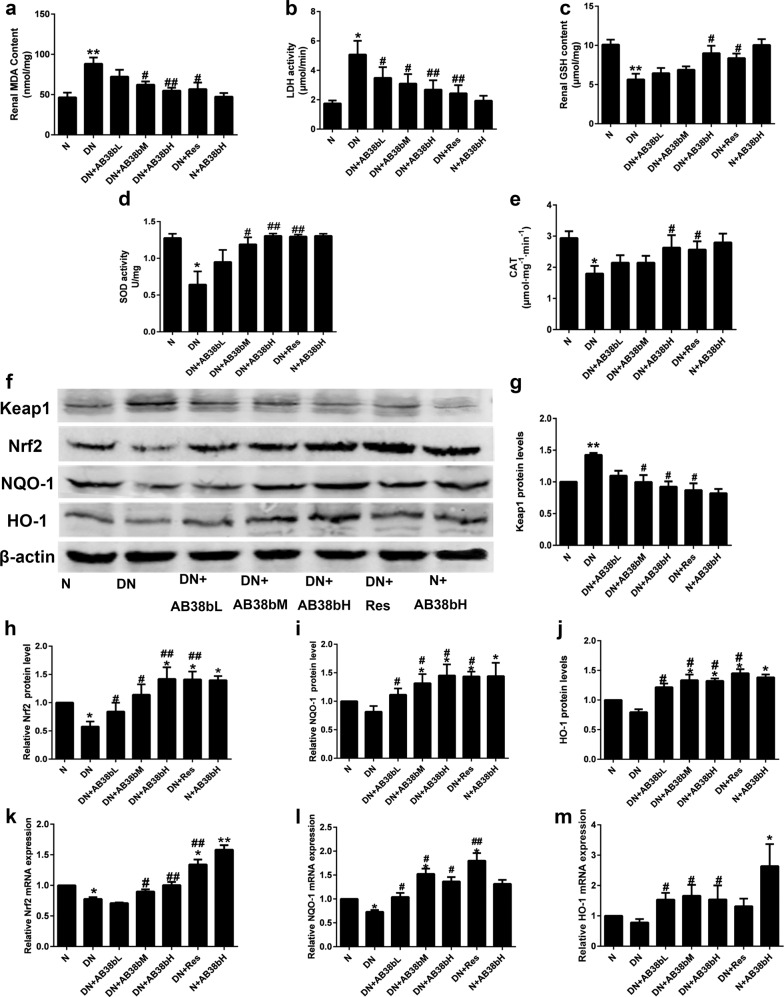
Fig. 4.
AB38b reduced oxidative stress while activating Nrf2 in diabetic kidneys. a MDA levels. b LDH activity. c GSH levels. d SOD activity. e CAT levels. f Protein levels of Keap1, Nrf2, NQO-1, and HO-1. g–j The densitometric analysis of the Western blots. The Keap1 g, Nrf2 h, NQO-1 i, and HO-1 j signals were normalized to the β-actin signals for the same samples to determine the fold-change relative to the control, the expression level of which was set as 1. k–m The relative mRNA expression levels of Nrf2 k, NQO-1 l, and HO-1 m in diabetic kidneys. The data are expressed as the mean ± SD, n = 6. *P < 0.05, **P < 0.01 vs. N; #P < 0.05, ##P < 0.01 vs. DN

