
Fig. 1.
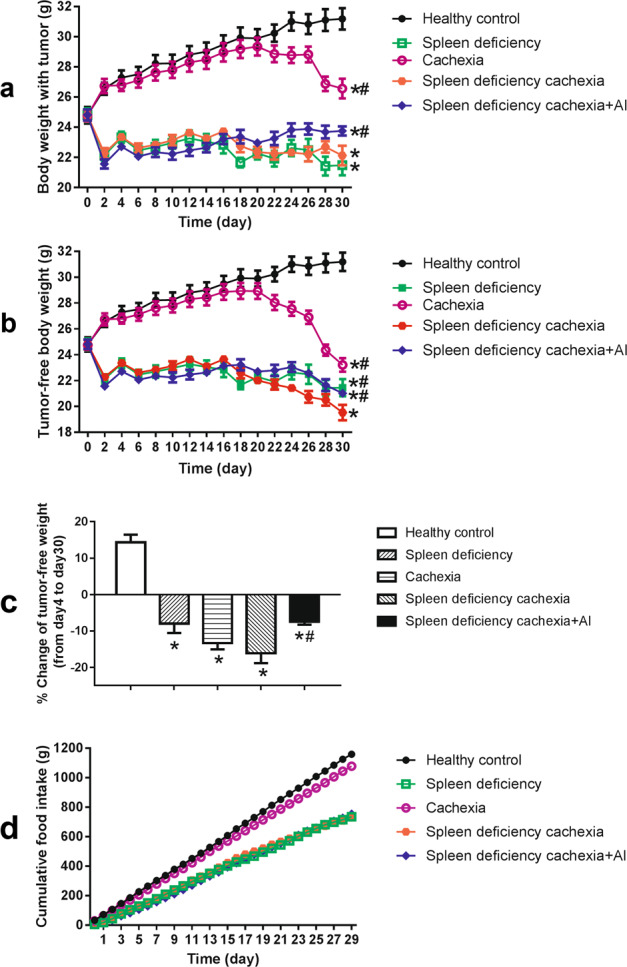
Body weight and food intake of different groups of mice. a Profiles of the time-related change in the body weight of mice. b Profiles of the time-related change in the tumor-free body weight of mice. c Percentage of change in the tumor-free body weight of mice from day 4 to day 30. d Cumulative food intake of mice. The data presented are the mean ± SEM. *P < 0.05 versus healthy control group. #P < 0.05 versus spleen deficiency with cachexia group