Fig. 4.
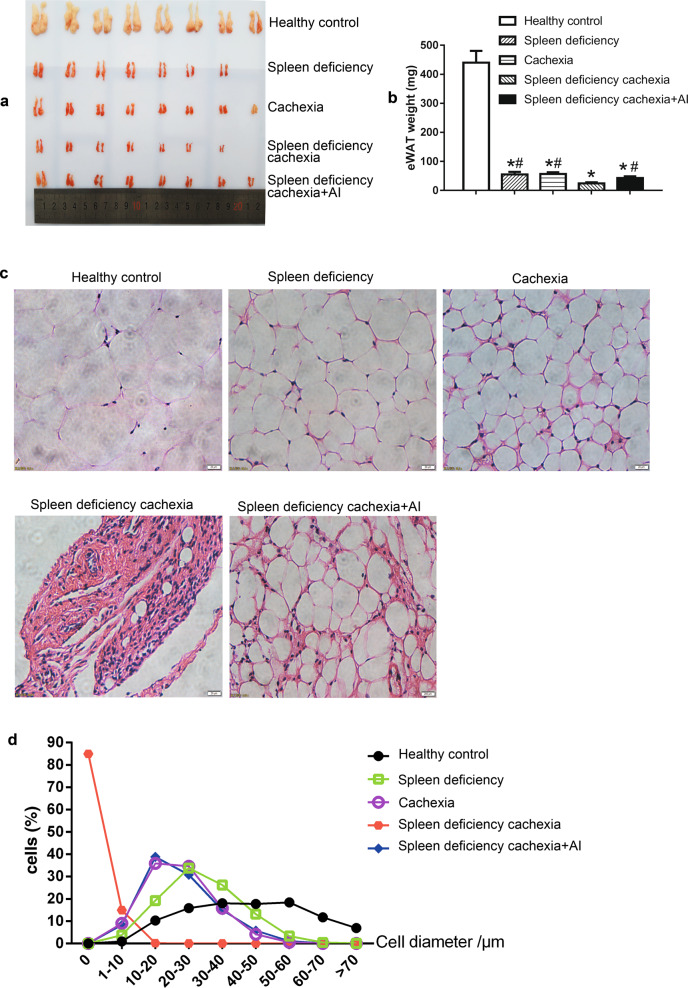
Fat lipolysis in different groups of mice. a Photo of eWAT. b Weight of eWAT. c Representative photo of H&E-stained sections of eWAT. Bar = 20 µm. d Results of quantitative analysis of the diameter of adipocytes in eWAT sections. The data presented are the mean ± SEM. *P < 0.05 versus healthy control group; #P < 0.05 versus spleen deficiency with cachexia group

