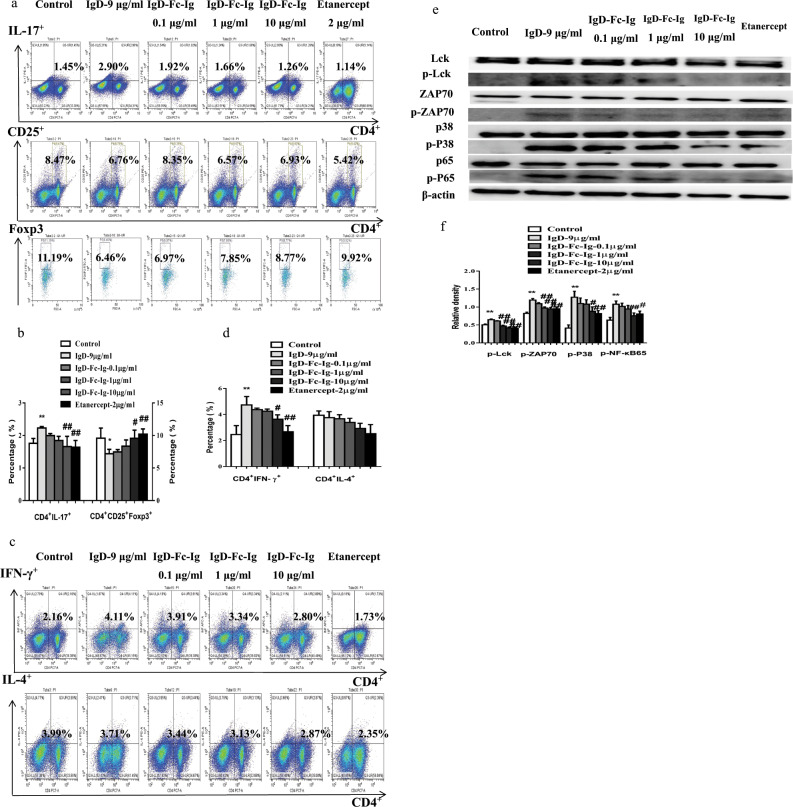
Fig. 7. The effects of IgD-Fc-Ig on T cell subsets and the expression of p-Lck, p-ZAP70, p-P38, and p-NF-κB65 in T cells stimulated by IgD.
a The percentages of Th17 and Treg cells were observed by flow cytometry. b Bar graphs show the percentages of CD4+IL-17+ Th17 cells and CD4+CD25+Foxp3+ Treg cells. c The percentages of Th1 and Th2 cells were observed by flow cytometry. d Bar graphs show the percentages of CD4+IFN-γ+ Th1 and CD4+IL-4+ Th2 cells. e The expression levels of p-Lck, p-ZAP70, p-P38, and p-NF-κB65 were analyzed by Western blotting. f The effects of IgD-Fc-Ig on the expression of p-Lck, p-ZAP70, p-P38, and p-NF-κB65. **P < 0.01 vs Control; #P < 0.05, ##P < 0.01 vs IgD 9 μg/mL (n = 10).

