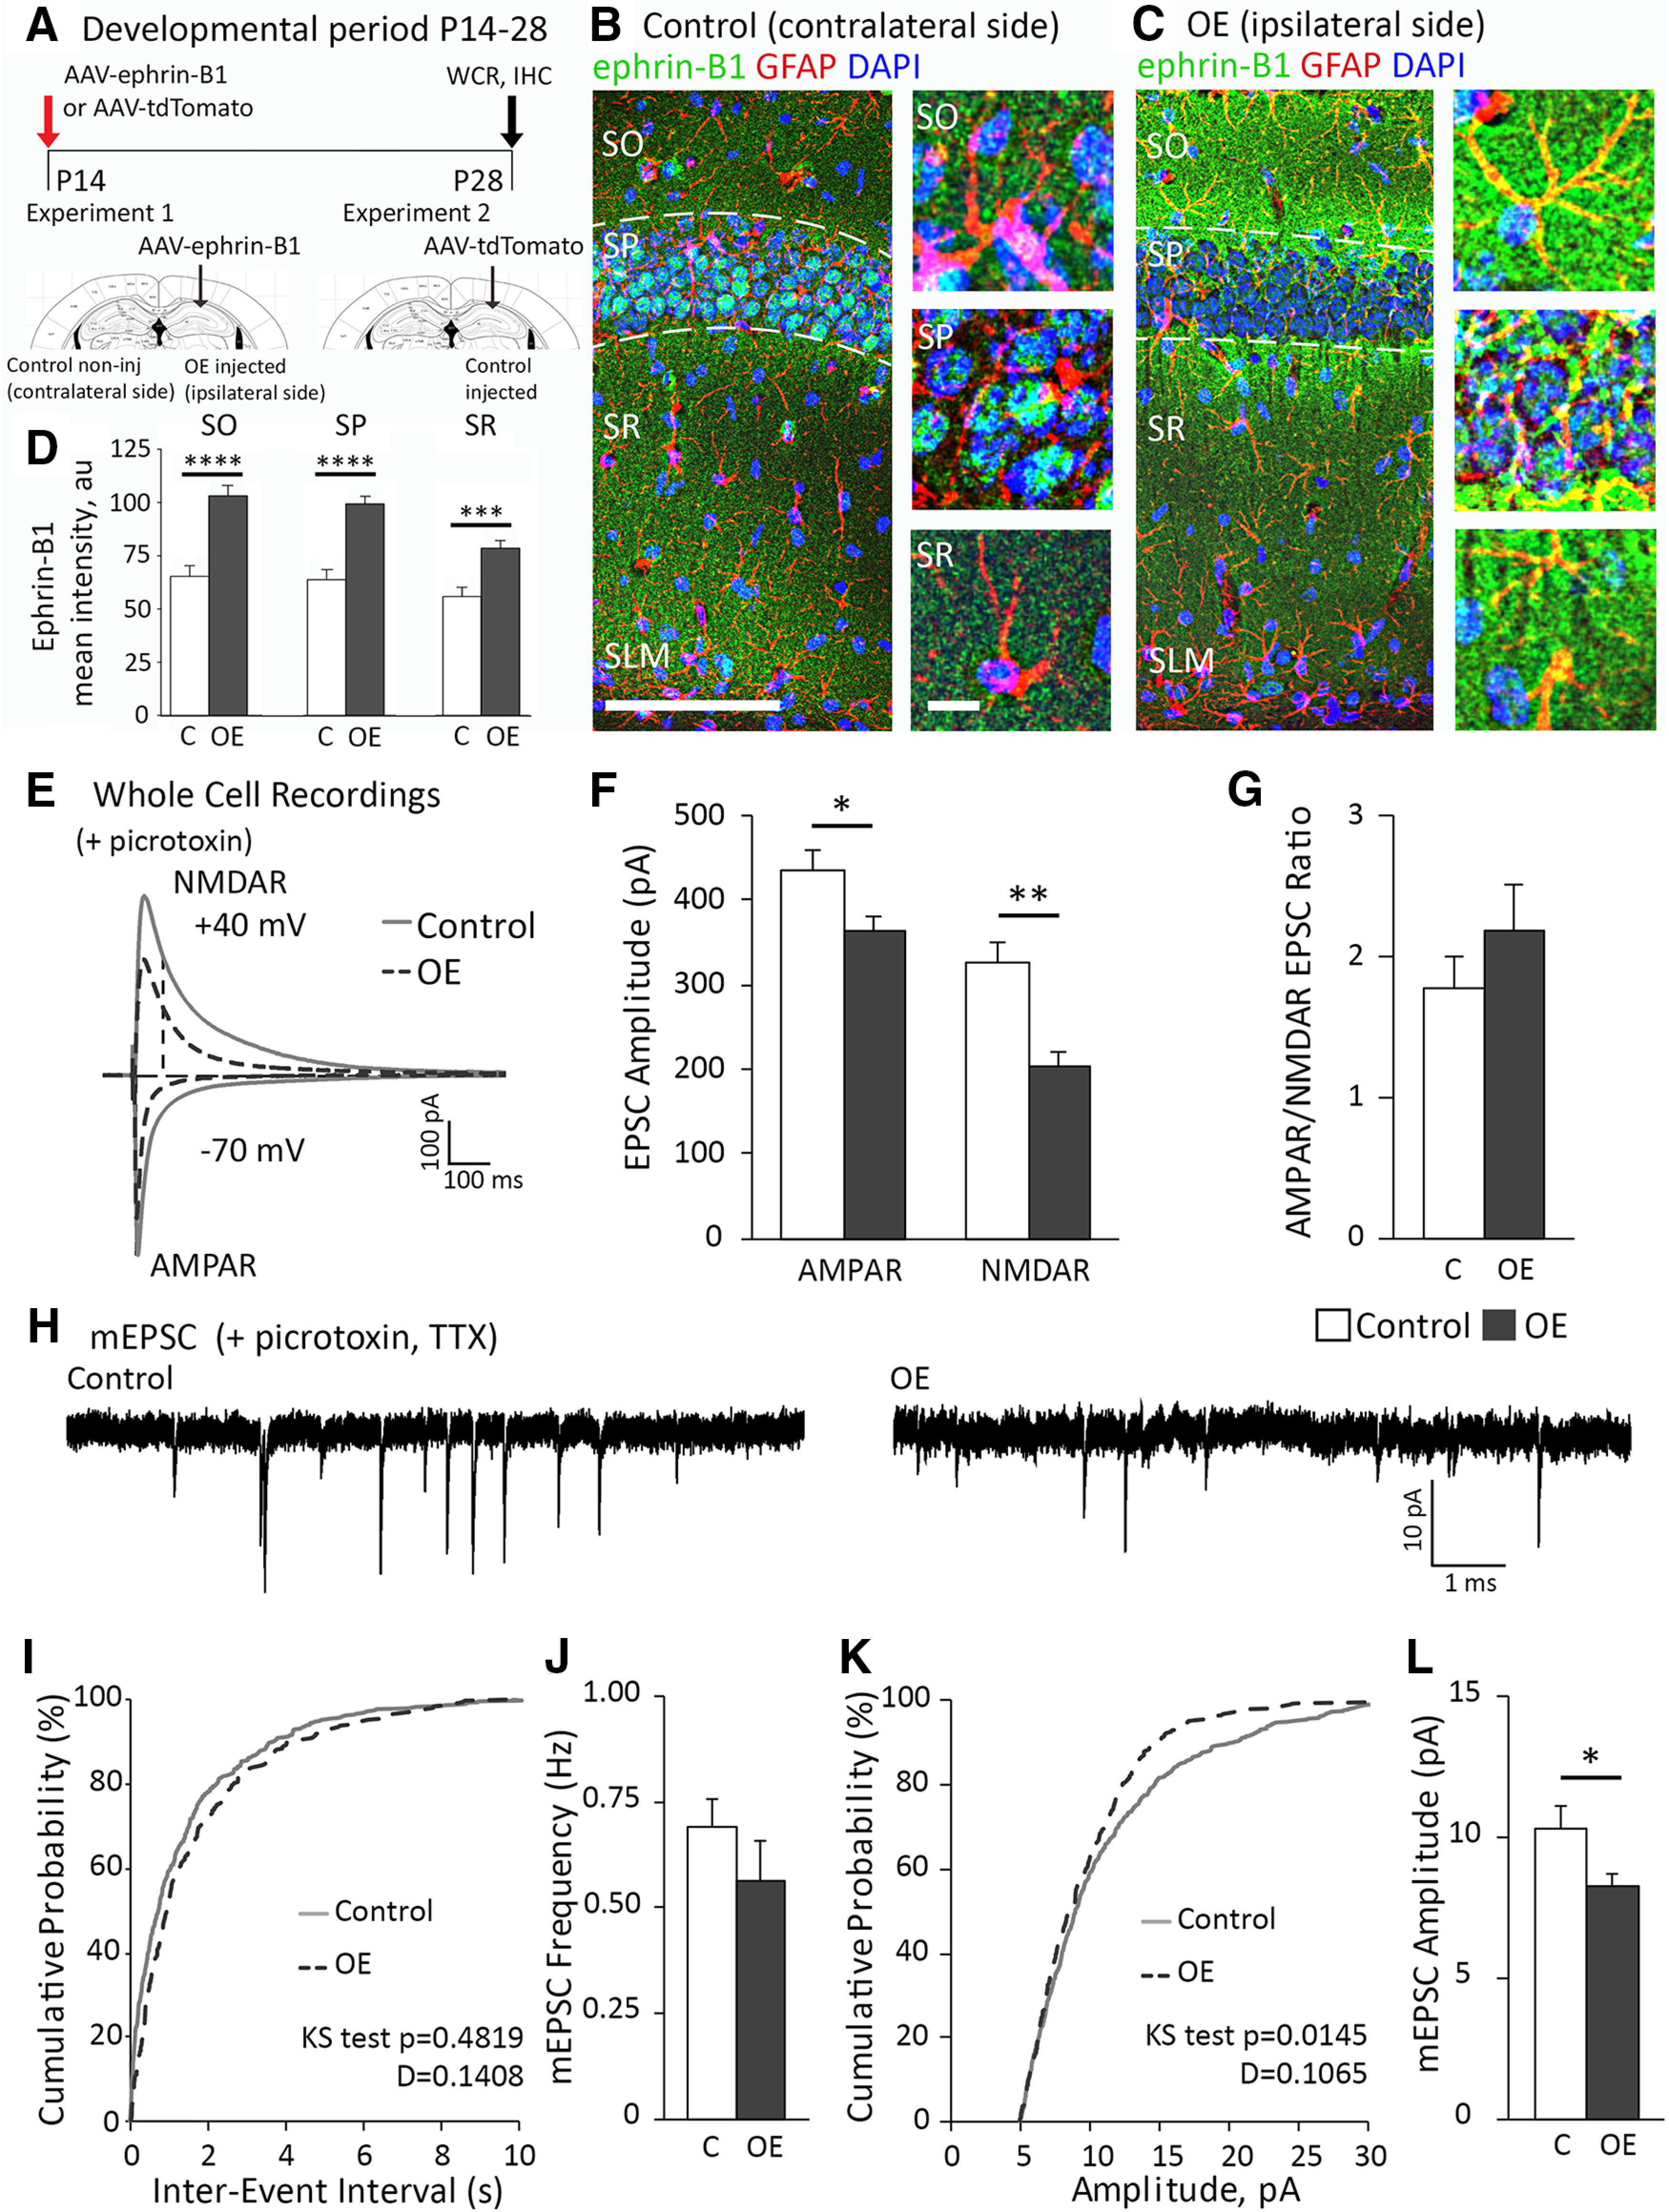
Figure 3.

OE of astrocytic ephrin-B1 in the developing hippocampus reduced evoked AMPAR- and NMDAR-mediated responses. A, Timeline of the VP injection: AAV-ephrin-B1 or AAV-tdTomato was stereotaxically injected unilaterally in the dorsal hippocampus at P14; experiments were performed at P28, 14 days after injection. B, C, Maximum projection confocal images represent GFAP (red) and ephrin-B1 (green) immunoreactivity with DAPI (blue) in the ipsilateral CA1 hippocampus injected with AAV-ephrin-B1 (OE) and contralateral noninjected CA1 hippocampus (Control). Scale bar, 200 µm. High-magnification images represent examples of ephrin-B1 immunoreactivity in astrocytes and neuronal cell bodies in SO, SP, and SR layers of CA1 hippocampus. Scale bar, 20 µm. D, Ephrin-B1 immunoreactivity was significantly increased in all layers of CA1 hippocampus in ipsilateral CA1 hippocampus injected with AAV-ephrin-B1 (OE) compared with contralateral noninjected CA1 hippocampus (Control) (n = 11-13, t test, ***p < 0.001; ****p < 0.0001; Extended Data Fig. 3-1). E, For electrophysiology, control group included recordings from ipsilateral side of AAV-tdTomato-injected mice and contralateral side of AAV-ephrin-B1-injected mice. Overexpressing group (OE) included recordings from ipsilateral side of AAV-ephrin-B1-injected mice. Representative traces of AMPAR- and NMDAR-evoked responses in CA1 hippocampal neurons of control (gray) and OE (dotted dark gray) P28 hippocampus with whole-cell recording in the presence of picrotoxin to block GABAergic inhibition. F, G, Graphs represent amplitude and corresponding ratio in AMPAR- and NMDAR-mediated currents (n = 11-14 cells, 5 mice per group; Extended Data Fig. 3-2). Evoked AMPAR- and NMDAR-mediated currents were significantly decreased; however, ratio was unchanged. H, Representative traces of mEPSCs in CA1 hippocampal neurons of P28 control and OE hippocampus; whole-cell recording was done in the presence of TTX and picrotoxin (n = 11-14 cells, 5 mice per group). I, The cumulative distribution of mEPSC interevent intervals in control (black) and OE (gray) groups. J, Average frequency of mEPSCs was not significantly different between control and OE groups, indicating potentially no effect on presynaptic activity (Extended Data Fig. 3-2). K, The cumulative distribution of mEPSC amplitude shows a significant leftward shift (smaller mESPC amplitude across the distribution) for OE (dotted dark gray) compared with control group (gray). L, Average amplitude of mEPSCs was lower in OE compared with control group (Extended Data Fig. 3-2). Graphs represent mean. Error bars indicate SEM. t test: *p < 0.05; **p < 0.01.
