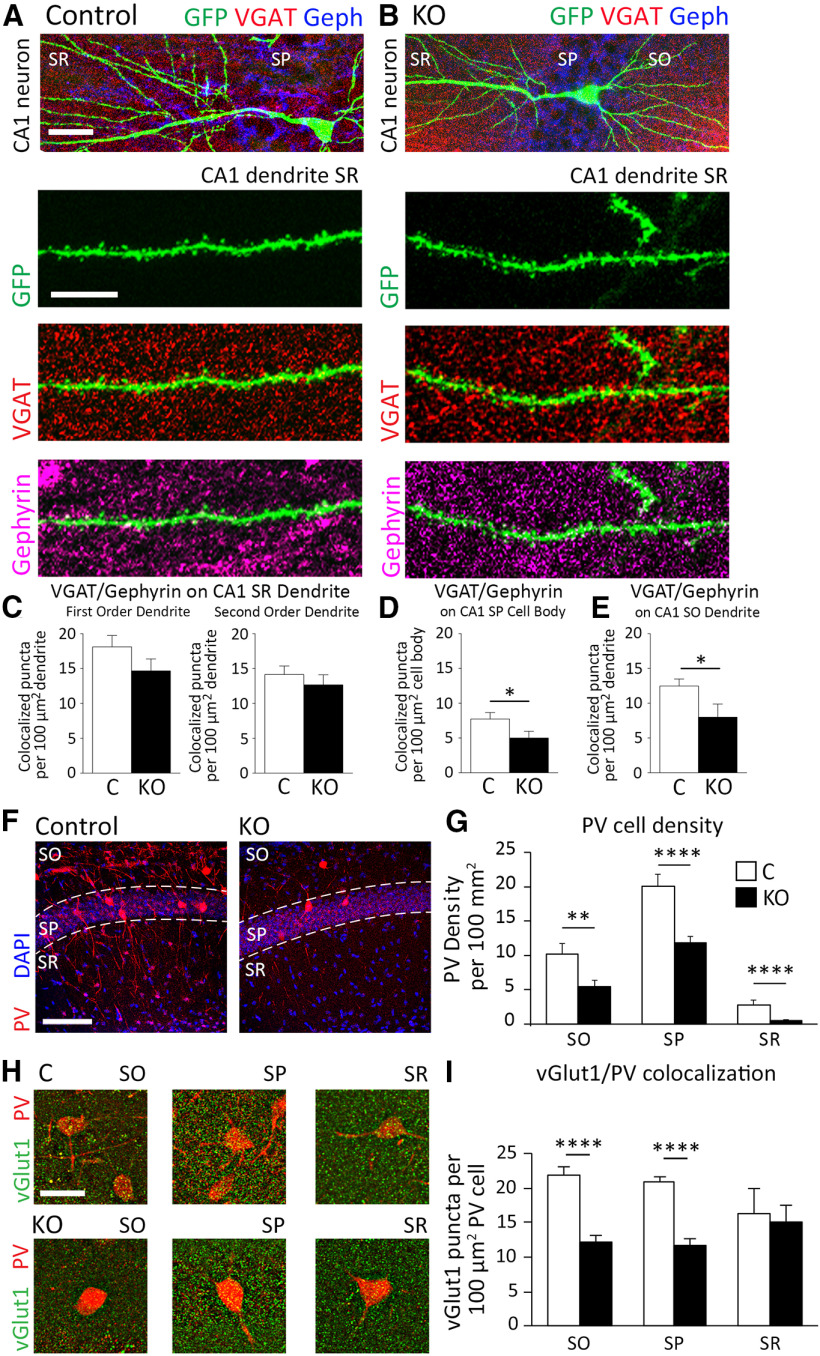
Figure 6.
Inhibitory synaptic sites on the CA1 pyramidal neurons and the density of PV-expressing inhibitory neurons are reduced following the deletion of astrocytic ephrin-B1 during early postnatal development. A, B, Confocal images represent CA1 excitatory neurons expressing GFP (green) costained with VGAT (red) and gephyrin (blue) to visualize inhibitory synaptic sites. Scale bar, 50 µm. High-magnification images represent GFP-expressing dendrites (green) with VGAT (red) and gephyrin (purple). Scale bar, 10 µm. C–E, Graphs represent VGAT/gephyrin colocalized puncta on GFP-expressing primary and secondary SR dendrites (C), neuronal cell bodies in SP (D) and SO dendrites (E) of CA1 neurons. KO mice exhibited a significant decrease in density of VGAT/gephyrin colocalized puncta on CA1 neurons in the SP and SO layers (n = 11-20 images; 4 mice per group, t test p < 0.05; Extended Data Fig. 6-1). F, Confocal images represent PV-expressing cells (red) and DAPI staining (blue) to identify CA1 hippocampal layers, SO, SP, and SR. G, Graph represents density of PV-expressing neurons in SO, SP, and SR layers of CA1 hippocampus. KO mice exhibited a significant decrease in density of PV-expressing inhibitory neurons in all three layers (n = 30-35 images; 3 mice per group; t test p < 0.01, p < 0.0001; Extended Data Fig. 6-2). H, Confocal images represent vGlut1 immunoreactivity (green) on PV-expressing cells (red) in the SO, SP, and SR layers of the CA1 hippocampus. Scale bar, 100 µm. I, Graphs represent colocalization of vGlut1 puncta and PV immunoreactivity in the SO, SP, and SR layers of the CA1 hippocampus (n = 10-40 cells, 3 mice per group; t test p < 0.0001; Extended Data Fig. 6-2). KO mice exhibit decreased numbers of excitatory vGlut1-positive boutons on PV-expressing inhibitory neurons in the SO and SP of CA1 hippocampus. Graphs represent mean. Error bars indicate SEM. *p < 0.05, **p < 0.01, ****p < 0.0001.

