Figure 7.
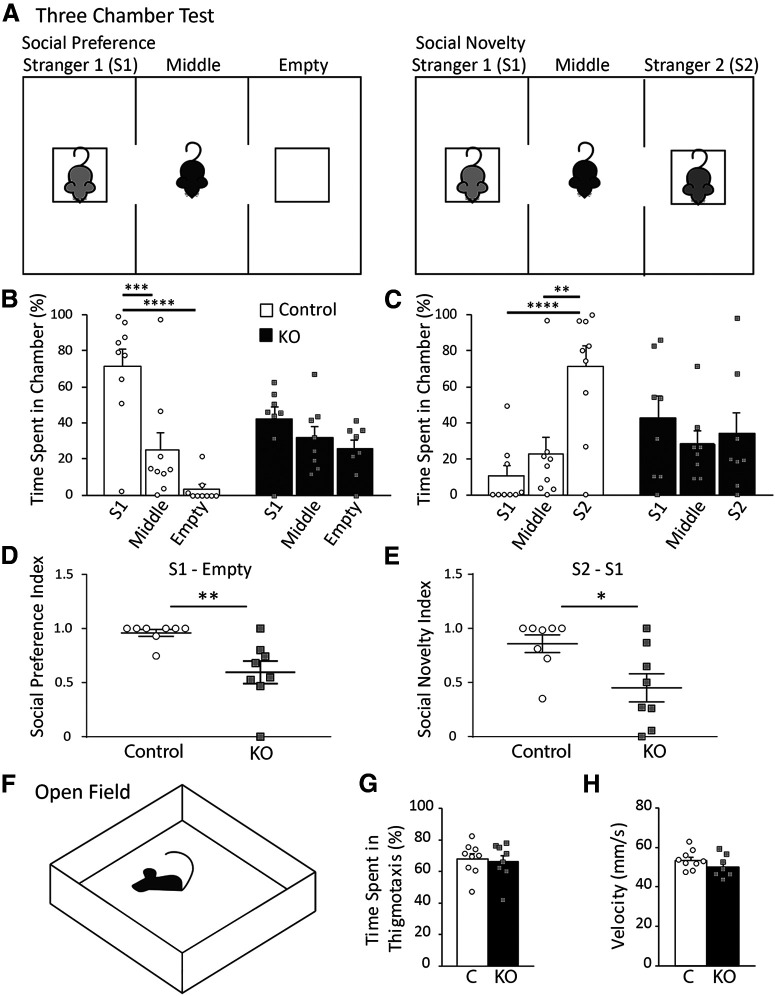
Ablation of astrocytic ephrin-B1 during early postnatal development affected mouse social behaviors. A, Diagram of three-chamber test for social preference and social novelty. Mice were placed in the middle chamber containing two side chambers and were tested in two 10 min sessions. During social preference test, a stranger mouse (S1) was placed in one of the side chambers, with the other chamber remaining empty. During social novelty test, now familiar stranger mouse (S1) remained in the side chamber, while a novel mouse (S2) was placed in the empty chamber. B, Graph represents time spent in either three chambers during social preference test. Control mice prefer spending time with S1 mouse compared with time in the middle (two-way ANOVA, Tukey's post hoc test, p = 0.0002) or empty chamber (two-way ANOVA, Tukey's post hoc test, p < 0.0001; Extended Data Fig. 7-1). KO mice show impaired sociability and spend the same amount of time in each chamber. C, Graph represents time spent in each chamber during social novelty test. Control mice spend significantly more time with novel S2 mouse than with familiar S1 mouse (two-way ANOVA, Tukey's post hoc test, p = 0.0005), or in the middle chamber (two-way ANOVA, Tukey's post hoc test, p = 0.0080; Extended Data Fig. 7-2), indicating normal social novelty. KO mice spend the same amount of time in S1, middle, or S2 chambers. D, Graph represents social preference index, calculated as . KO mice show a significant reduction in social preference index (t test, p = 0.0049), with a value near 0.5 indicating time spent between S1 chamber and the empty chamber was nearly equal (Extended Data Fig. 7-3). E, Graph represents social novelty index, calculated as . KO mice show a significant reduction in social novelty index (t test, p = 0.0186), with a value near 0.5 indicating equal time spent between S2 and S1 chambers (Extended Data Fig. 7-3). F, Schematics of open field test; during testing animals were allowed to freely explore the open field for 10 min while time spent in thigmotaxis, and average velocity were measured. G, Graph represents percent time spent in thigmotaxis with no significant differences between control and KO mice (t test, t(15) = 0.3455, p = 0.7345; Extended Data Fig. 7-4). H, Graph represents average velocity of control and KO mice (t test, t(15) = 0.1.214, p = 0.2435; Extended Data Fig. 7-4). Graphs represent mean. Error bars indicate SEM. *p < 0.05, **p < 0.01, ***p < 0.001, ****p < 0.0001.

