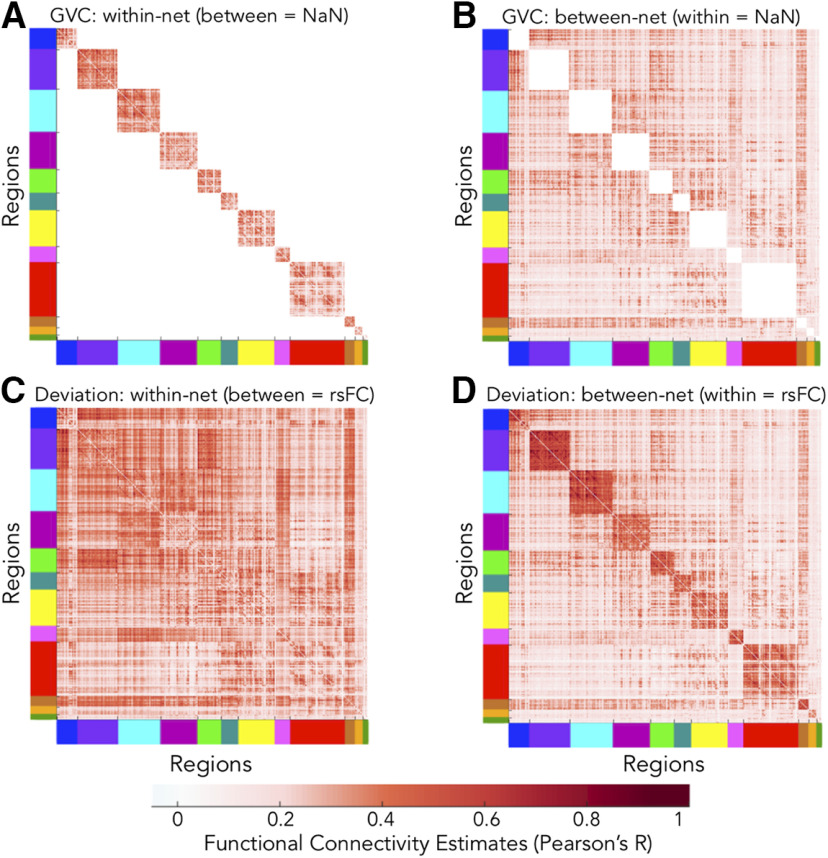
Figure 5.
Input data schemes used in computing measures of the secondary cognitive control cartographies. Data refers to FC estimates (Pearson's R; colored according to the bottom-most scale). Put another way, each panel contains modified correlation matrices. The cross-state means are visually represented, but analyses included all 64 C-PRO task states. Axes are color coded according to the empirically-adjusted CAB-NP (Fig. 3). A, Representation of input data for within-network GVC. Between-network FC estimates were set to NaN (white). B, Input data for between-network GVC. Within-network FC estimates were set to NaN (white). C, Input data for within-network deviation. Between-network FC estimates were set to their resting-state values. D, Input data for between-network deviation. Within-network FC estimates were set to their resting-state values.

