Figure 3.
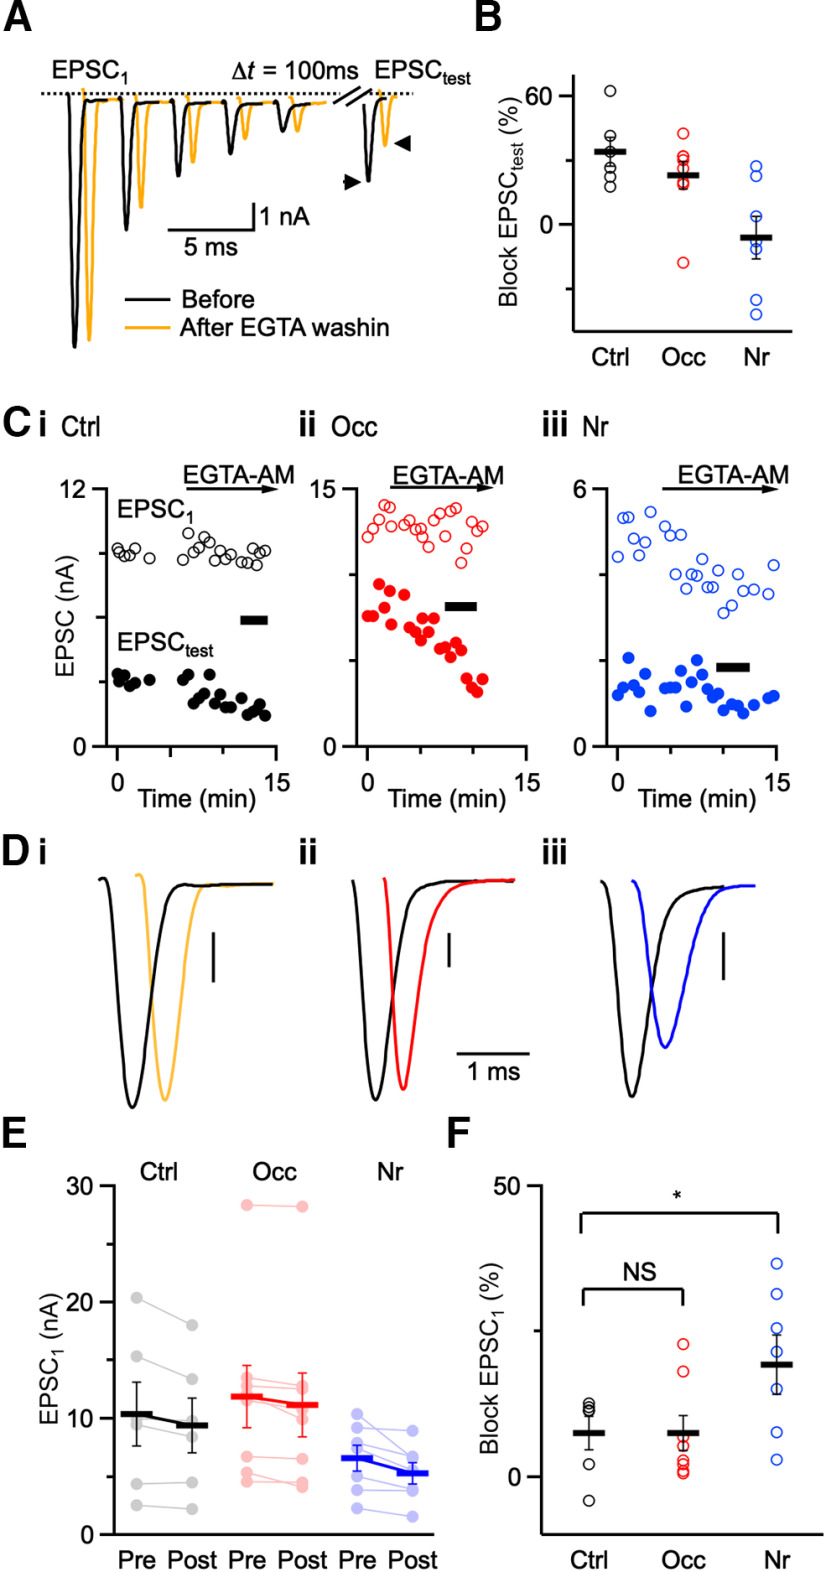
Effects of EGTA-AM. A, Representative traces from a control mouse showing effects of 20 μM EGTA-AM on EPSCs. There was little effect on EPSC amplitude during 5-pulse, 100-Hz trains, but significant reduction of a test pulse (EPSCtest) after 100 ms recovery. B, Relative decrease in EPSCtest following wash-in of EGTA-AM (Ctrl: 6 cells; Occ: 8 cells; Nr: 7 cells). EPSCtest decreased significantly in both control and occluded groups, but not after noise-rearing. C, Time course of EGTA-AM wash-in for EPSC1 and EPSCtest. Black bars represent traces averaged in D. D, Average traces before (black) and after (color) EGTA-AM application. All traces are average of 5-10 trials. E, Individual EPSC1 amplitude of all recordings before and after application of EGTA-AM under different acoustic conditions (Ctrl: 6 cells; Occ: 8 cells; Nr: 7 cells). F, Percent block of EPSC1 after applying EGTA-AM in control, occluded, and noise-reared mice. EGTA-AM blocks EPSC1 more effectively in noise-reared mice than in control and occluded mice (p = 0.04). *p < 0.05, NS = not significant (p > 0.05).

