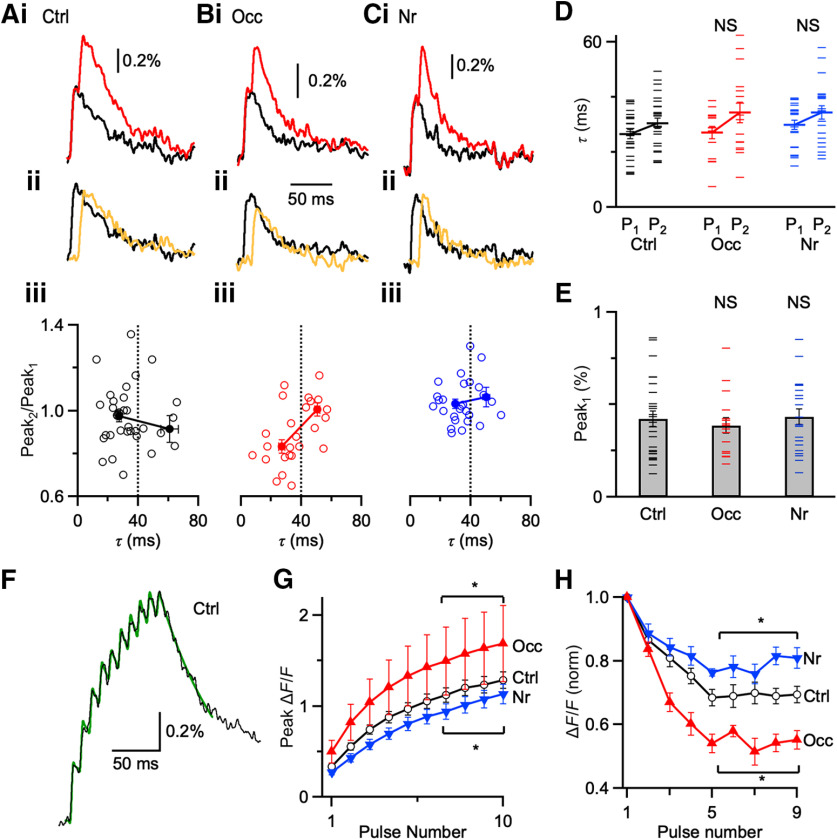
Figure 5.
Changes in Ca2+ influx. A–C, Ca2+-fluorescence transients are recorded with photodiode and evoked by one stimulus (black) and paired stimuli (Δt = 10 ms, red) from control (Ai), occluded (Bi), and noise-reared (Ci) endbulbs. Middle traces (Aii, Bii, Cii) represent the single stimulation (black) compared with the subtracted response, showing only response to the second pulse (yellow). Every trace represents an average of 15-20 trials. Bottom panels (Aiii, Biii, Ciii) represent the amplitude of the second peak normalized to the first (Peak2/Peak1) for transients of different decay rate constants (τ). Occluded endbulbs (B) with τ faster than 40 ms showed evidence of saturation (Peak2/Peak1 < 1), indicating that calcium levels approached the KD of calcium green-1 (25 cells). Occluded endbulbs with τ slower than 40 ms did not show saturation (Peak2/Peak1 near 1), indicating that they were overloaded. Saturation was significantly lower in control and noise-reared endbulbs, indicating lower Ca2+ influx. Dashed line at 40 ms indicates maximal decay tau for data used in analyses in D–H. D, Decay τ of Peak1 and Peak2 from control, occluded, and noise-reared endbulbs. (Ctrl: 27 cells; Occ: 16 cells; Nr: 21 cells). E, Average Peak1 amplitudes from three conditions. Peak amplitudes from endbulbs of occluded and noise-reared mice are not significantly different from control (p > 0.05). F, Representative Ca2+ transient from a P20 control mouse following 10 pulses of 100 Hz stimulation. Black trace represents the average of 12 trials. Green trace represents a fit for measuring peak amplitudes (see Results). G, Average peak fluorescence during trains for different acoustic conditions (*p < 0.05). H, Average step increases in fluorescence for peaks 1–9 from three acoustic conditions (11–14 cells each condition). *p < 0.05, NS = not significant (p > 0.05).

