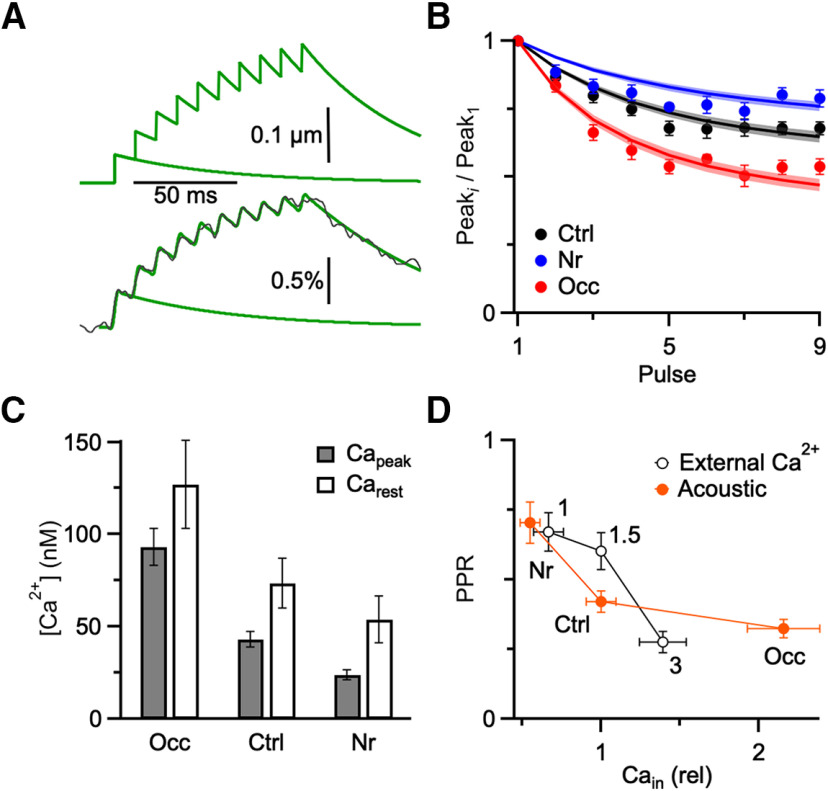
Figure 7.
Comparing the effects of acoustic experience or external Ca2+ on Ca2+ influx and PPR. A, Model of Ca2+ influx (top) with Capeak = 50.9 nM, Carest = 67.1 nM, and decay τ = 52.6 ms, and the modeled ΔF/F signal (bottom, green lines) for a dye with characteristics similar to calcium-green 1 (KD = 540 nM, 15-fold change in brightness on binding Ca2+). The model was fit to a ΔF/F recorded from a control endbulb (bottom, black line). B, Fits of model illustrated in A (lines) to imaging data from Figure 5 for the three acoustic conditions (markers). C, Capeak and Carest from different acoustic conditions are measured from the model (Ctrl: n = 14; Nr: n = 14; Occ: n = 11). D, Comparison between Ca2+ and PPR changes for endbulbs manipulated by acoustic conditions (red, closed markers) or Cae (black, open markers). For acoustic conditions, Ca2+ data are from the modeling analysis in B, and PPR data are from Figure 4. For Cae, data are from the imaging and electrophysiology experiments of cooperativity in Figure 6. Overlap of these curves suggests that changes in Ca2+ account for acoustically-driven changes in PPR.

