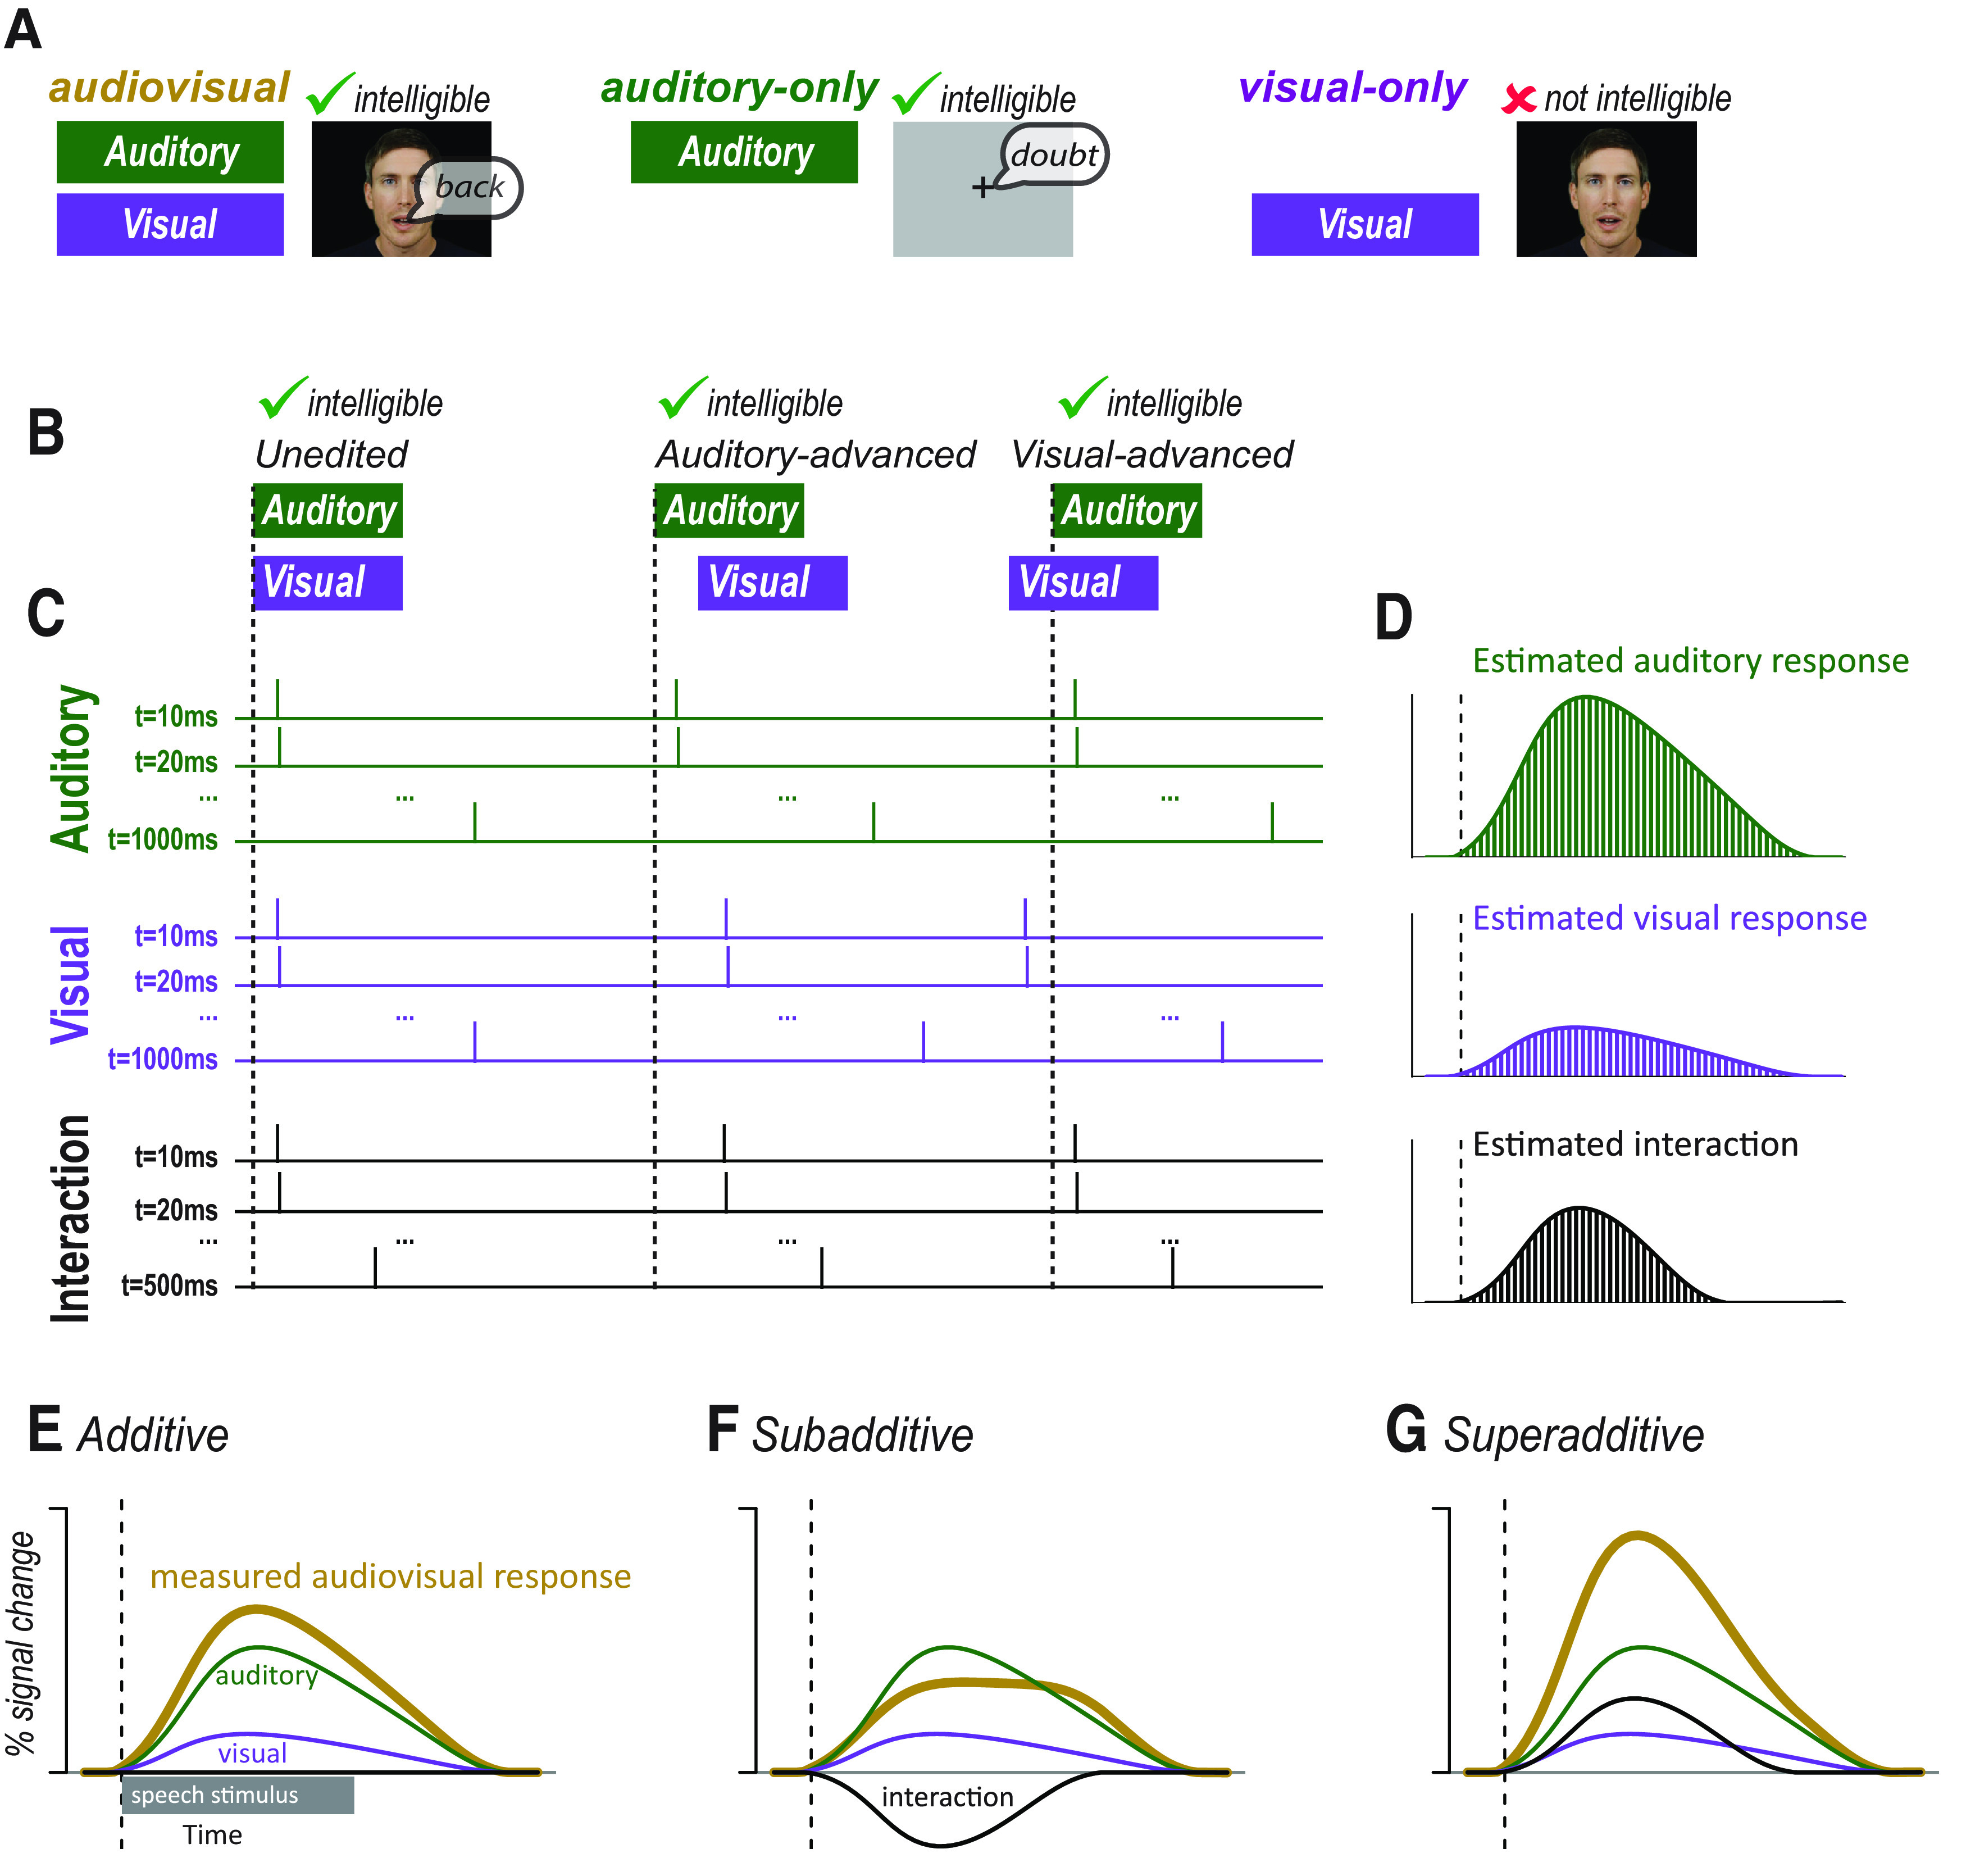
Figure 1.

A, In many studies, audiovisual speech, auditory-only speech, and visual-only speech are presented. Comparing neural responses to these stimuli is confounded by the fact that audiovisual and auditory-only speech is intelligible whereas visual-only speech is not. B, An alternative approach is to present audiovisual speech with varying asynchrony. Audiovisual speech can be unedited (synchronous), edited so that the auditory component of the speech is moved earlier (auditory-advanced), or edited so that the visual component of the speech is moved earlier (visual-advanced). All three types of speech are intelligible. C, Modifying the synchrony of the auditory and visual speech components allowed for the component responses to be estimated using deconvolution. The responses to auditory and visual speech were estimated with one predictor for each 10 ms time point of the response. Each predictor consists of a δ or tent function with amplitude of 1 at a single time point of the response and an amplitude of 0 at other time points (for simplicity, only the first, second, and last predictors are shown). Ellipsis indicates the remainder of the predictors. The sum of the predictors were fit to the measured neural response using a GLM to create an independent estimate of the auditory and visual responses. If auditory and visual speech begins at the same time, as shown for the unedited stimulus, the Audt = 10 ms and Vist = 10 ms regressors are identical, making it impossible to determine their relative amplitudes. If additional stimuli are presented for which the auditory speech and visual speech are temporally asynchronous, as shown for the auditory-advanced and visual-advanced stimuli, then the Audt = 10 ms and Vist = 10 ms regressors are offset. If many stimuli are presented with different asynchronies, the complete time courses of the auditory and visual responses can be estimated. The auditory and visual responses were modeled for 1 s after speech onset; the interaction response was modeled for 500 ms after speech onset. For complete design matrix, see Extended Data Figures 1-1 and 1-2. D, After the amplitude of each regressor was estimated by fitting to the measured neural response to all stimuli, the value of each time point regressor was plotted to show the time course of the component responses. Bars represent the amplitude of the regressor modeling each individual time point of the response: green represents auditory; purple represents visual; black represents interaction. E, Gold curve indicates the measured response to audiovisual speech. If there are little or no interactions between modalities, the measured response will be equal to the sum of the estimated auditory (green) and visual (purple) responses. The interaction term will be 0 (black line along x axis). F, If the interactions between modalities are subadditive, the measured response will be less than the sum of the estimated auditory (green) and visual (purple) responses. The interaction term will be negative. G, If the interactions between modalities are superadditive, the measured response will be less than the sum of the estimated auditory (green) and visual (purple) responses. The interaction term will be positive.
