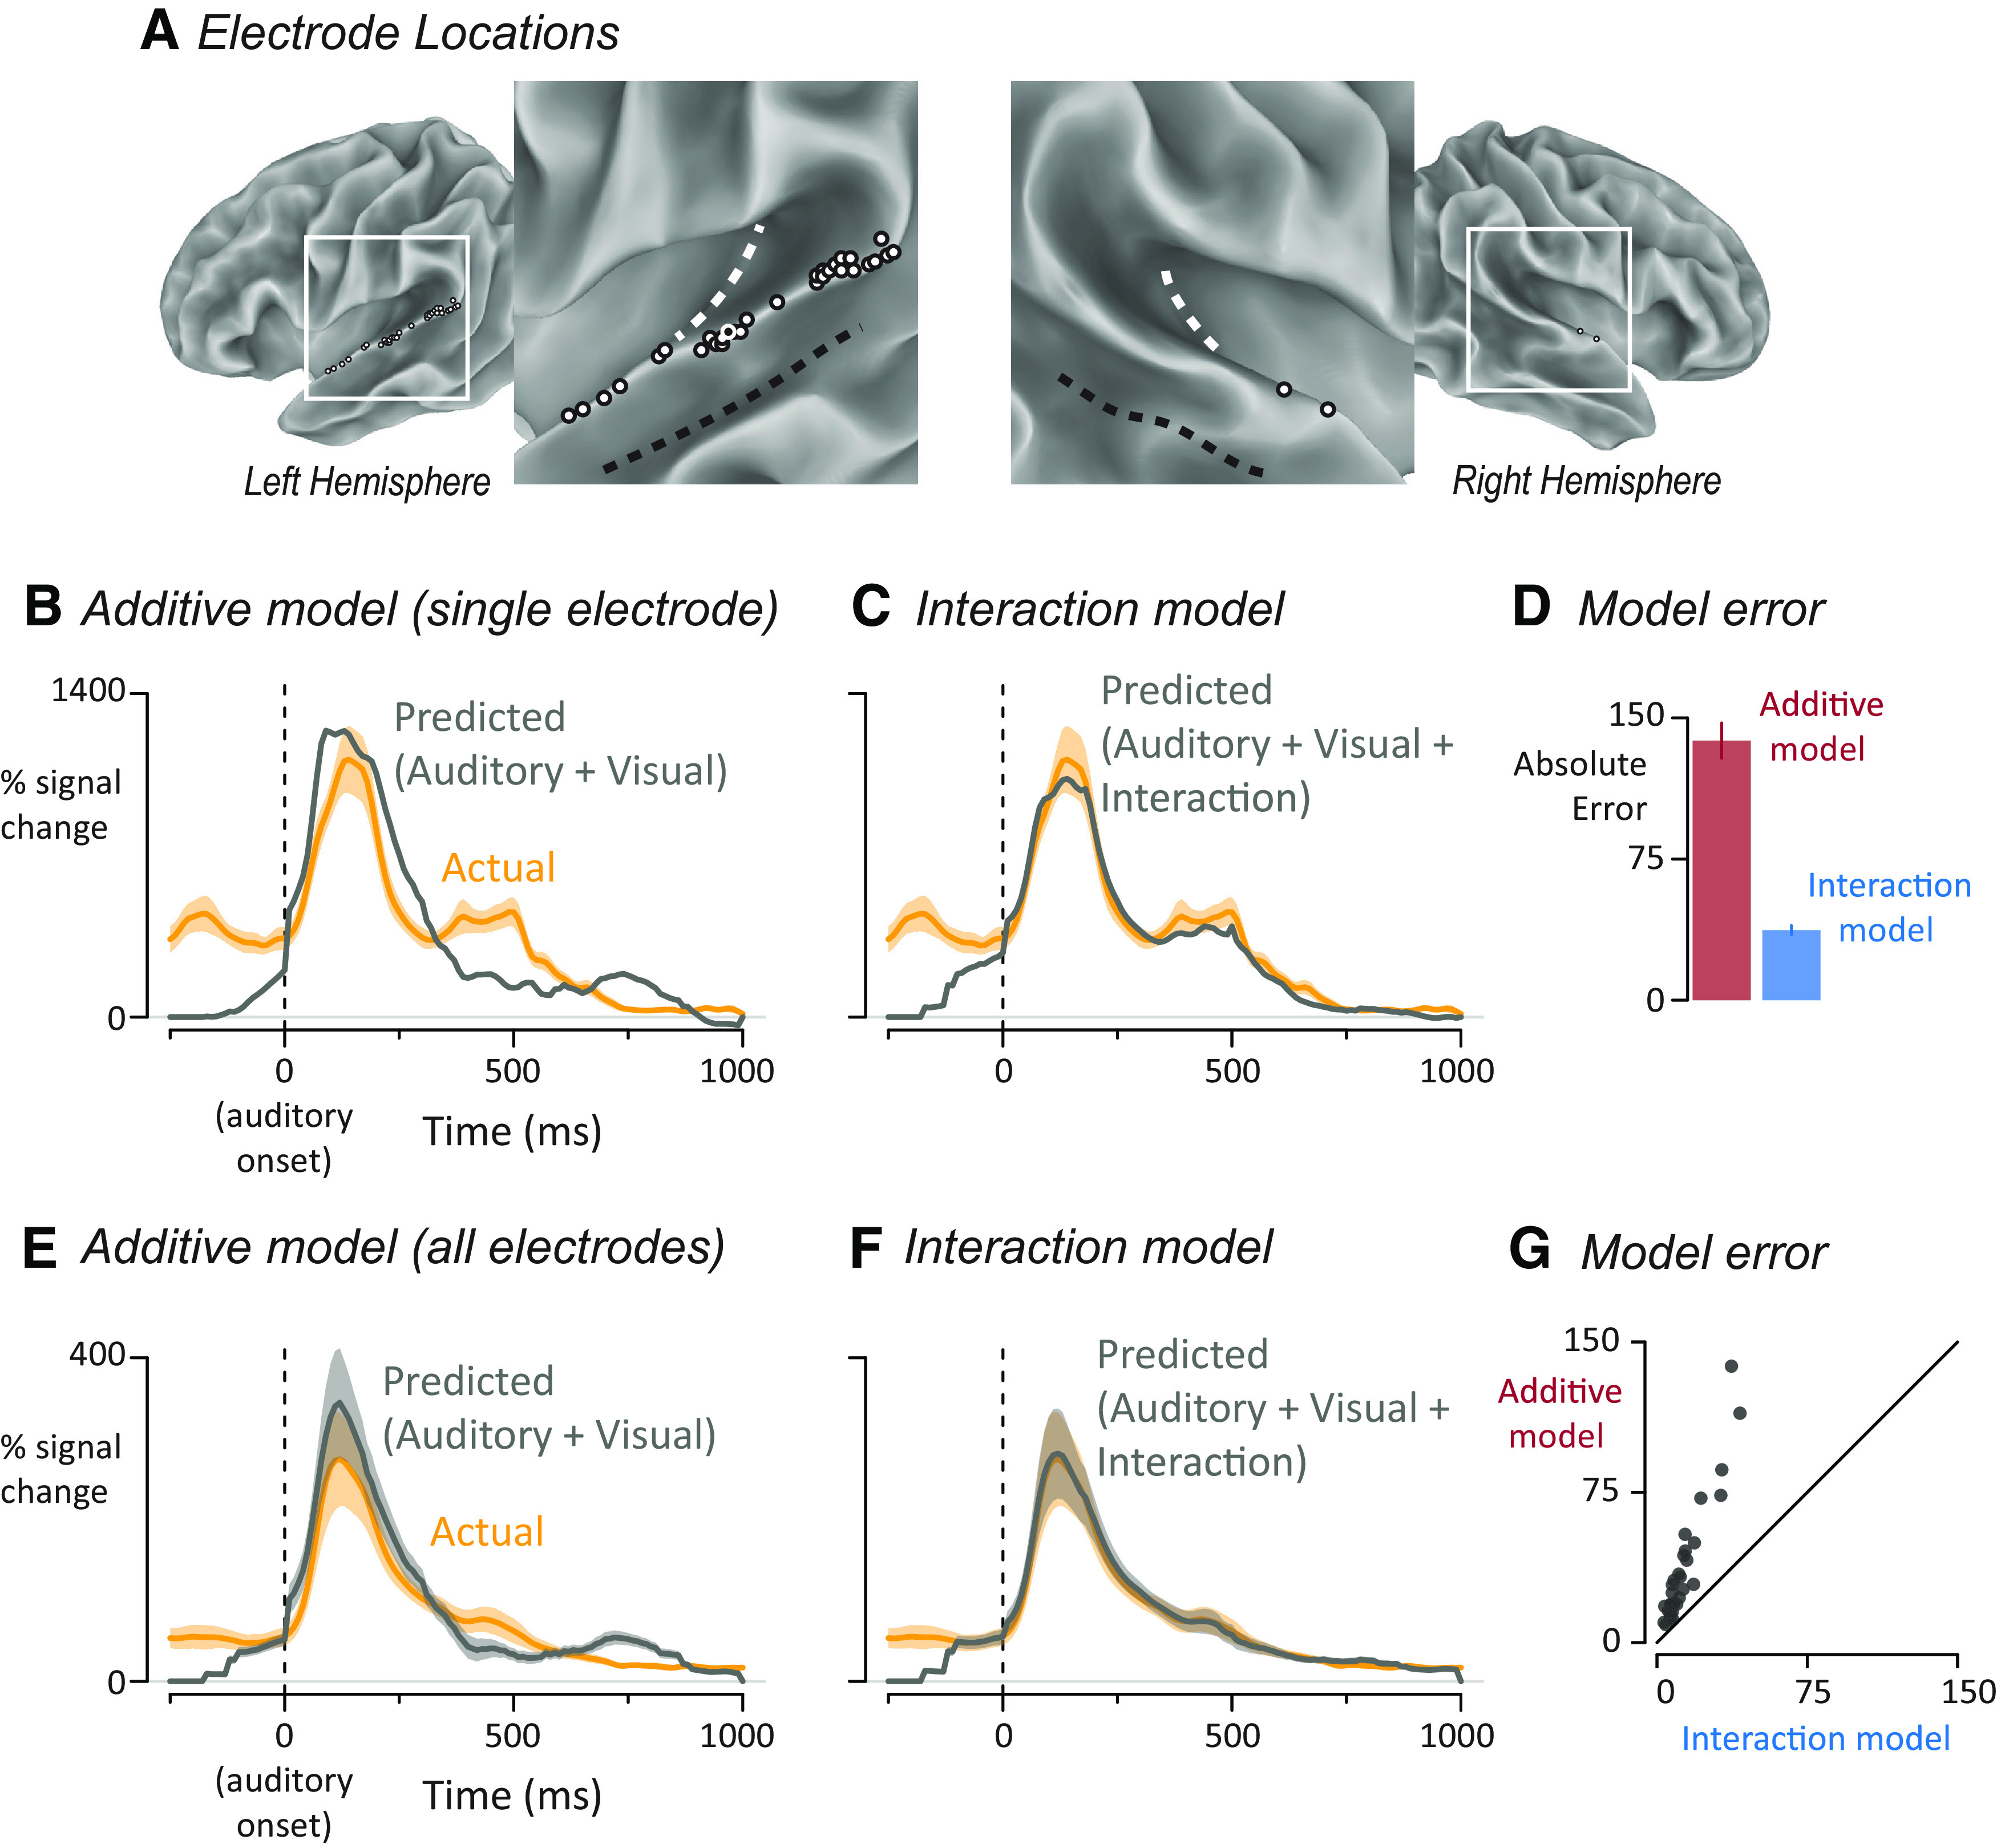
Figure 2.

A, The location of left-hemisphere (left; n = 31) and right-hemisphere (right; n = 2) electrodes that met both an anatomic criterion (located on the posterior superior temporal gyrus) and a functional criterion (significant response to speech) displayed on a partially inflated cortical surface model. White dashed line indicates Heschl's gyrus. Black dashed line indicates the fundus of the superior temporal sulcus. Each electrode is shown as a white circle with a black outline, except for one electrode shown as a black circle with a white outline, corresponding to electrode YAR-22, responses shown in B–D. B, Yellow line indicates the measured response of a single electrode (YAR-22) to audiovisual speech with auditory speech onset at time 0 and response in units of percent increase of BHA from prestimulus baseline. The mean ± SEM (yellow shaded area) at each time point was calculated across trials. Gray line indicates the predicted time series from the additive model in which auditory and visual responses were summed. C, For this electrode, the predicted response (gray line) of the interaction model in which auditory, visual, and interaction estimates were summed. Actual response same as in B. For measured and predicted responses for both models for all individual electrodes, see Extended Data Figure 2-1. D, For this electrode, the error for each model was calculated by taking the absolute difference between the predicted and measured response at each time point and calculating the mean ± SEM across time points. E, Yellow curve indicates the mean ± SEM across electrodes of the response to audiovisual speech. For each electrode, an additive model was created in which auditory and visual responses were summed to generate a predicted audiovisual response. Gray curve indicates mean ± SEM of the predicted response across electrodes. F, For each electrode, an interaction model was created in which auditory, visual, and interaction responses were summed to generate a predicted response. Actual response same as in E. G, Model error for the additive and interaction models plotted against each other, one symbol per electrode.
