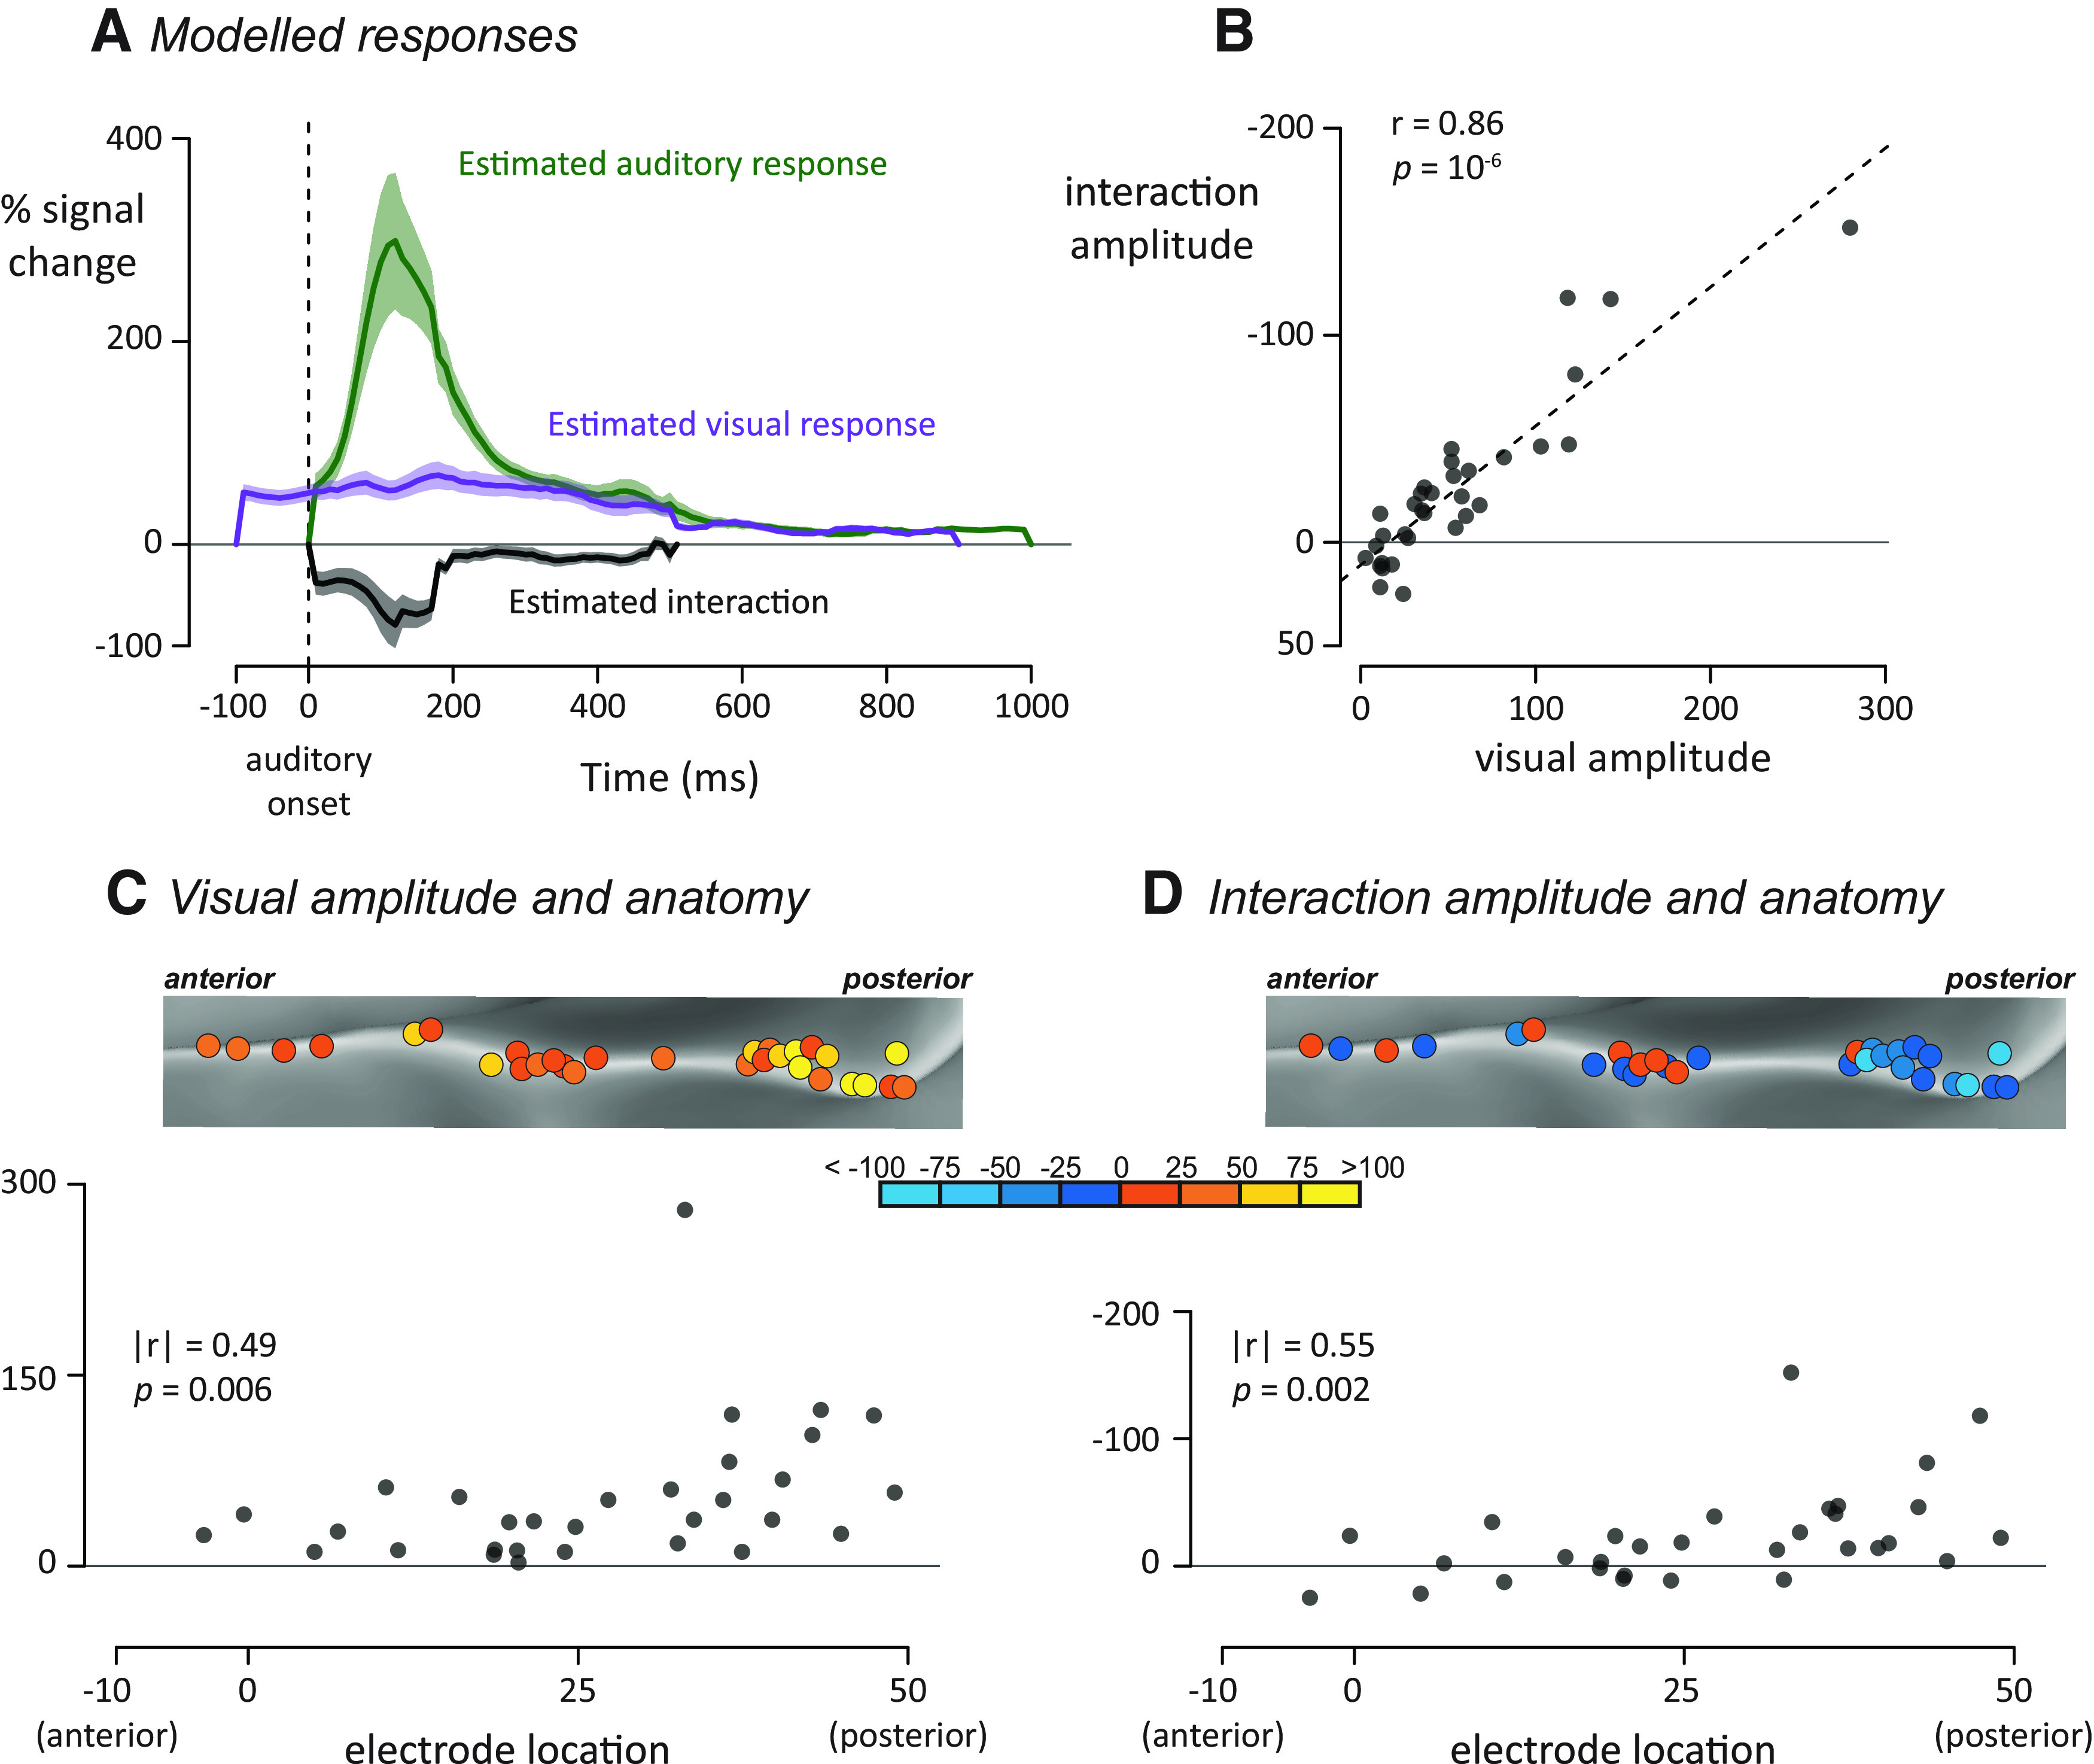
Figure 3.

A, For each electrode, an interaction model was fit to generate modeled auditory (green), visual (purple), and interaction (black) time courses. Plots represent mean ± SEM across all electrodes. For estimated responses for all individual electrodes, see Extended Data Figure 3-1. B, For each electrode, the visual response was plotted against the average interaction response, one symbol per electrode. C, All left hemisphere electrodes (rotated version of Fig. 2A, left) colored by their visual response amplitude. Bottom, Plot of anterior-to-posterior location in standard space against visual response amplitude. D, Left hemisphere electrodes colored by their interaction amplitude. Bottom, Plot of the same data.
